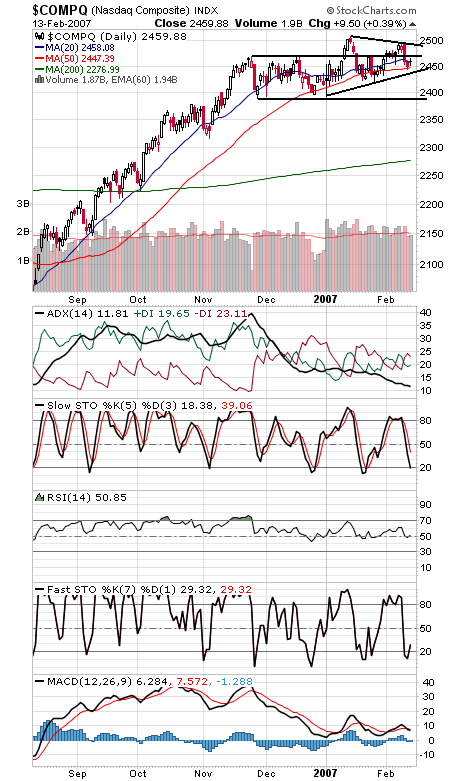
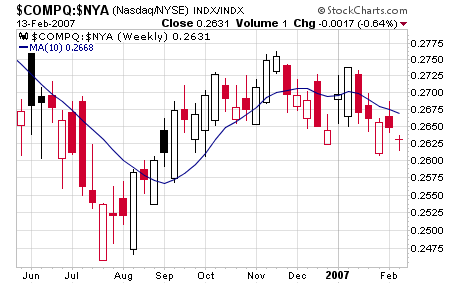
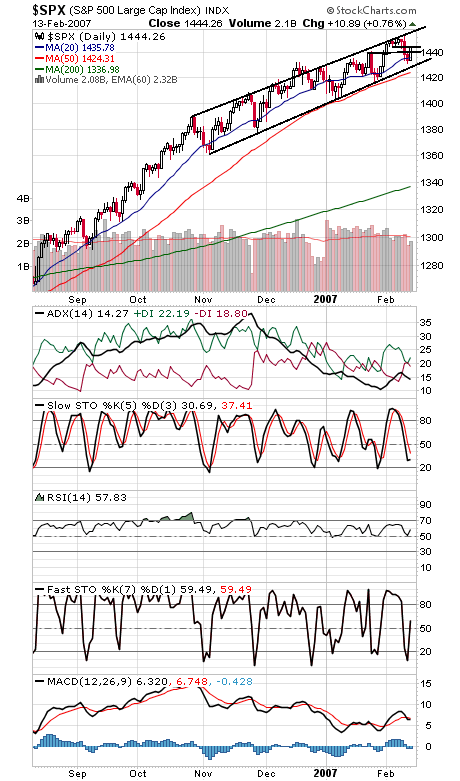
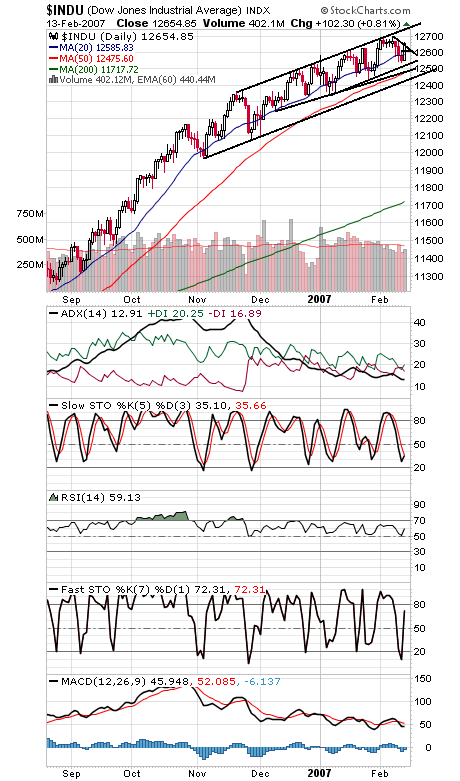
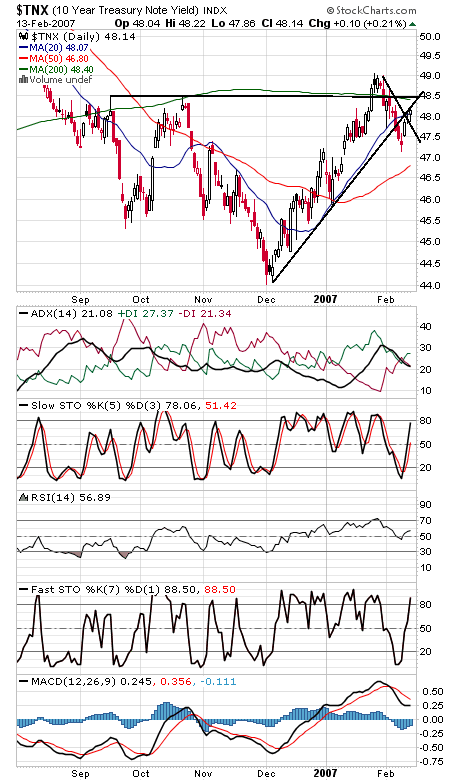
Even when the market goes up, the Nasdaq (first two charts below) manages to fall even further behind the blue chips. It’s been a tough couple of months for tech investors. The big question after today is whether the lows have been seen for this pullback. Our answer is a qualified “likely” — but we want to see more life out of the tech sector to confirm it. In any event, pre-holiday trading will likely extend today’s gains in the next few days. 2471 and 2490 are resistance for the Nasdaq, and support should now be 2440-2450. The S&P (third chart) turned up before testing its November channel line, a sign of strength, since buyers had to raise their bids to do that. 1440 is first support on the S&P, and resistance is 1446 and 1453. The Dow (fourth chart) was the strongest index today — and if you bought our picks from late October, you had an even better day. That simple strategy is up 12% since Oct. 30, compared to a 4% gain for the Dow. While it’s easy to confuse a bull market with genius, perhaps outperforming the market is just that simple. 12,700 and 12,750 are next resistance for the Dow, and first support is 12,607. 10-year yields (fourth chart) are pointed back up for now, but they face a whole lot of resistance here. Retail sales and PPI data in the next few days should be interesting.
