SHARE
Facebook X Pinterest WhatsApp

Technical Analysis: Techs Break Out

Written By
thumbnail
Paul Shread
Paul Shread
Oct 27, 2006

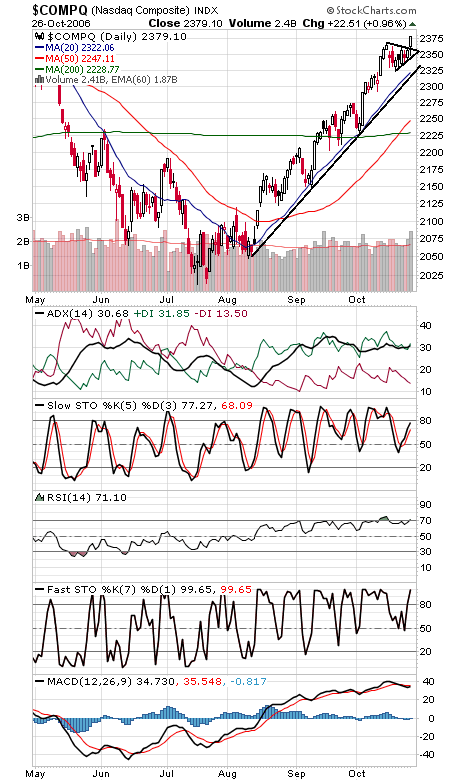
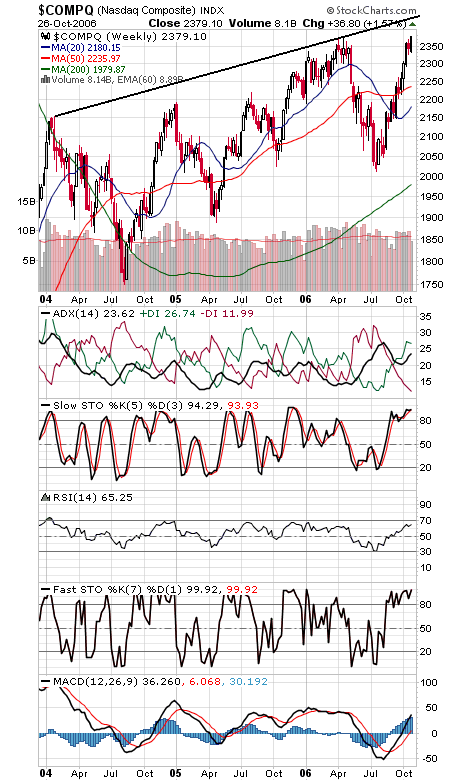
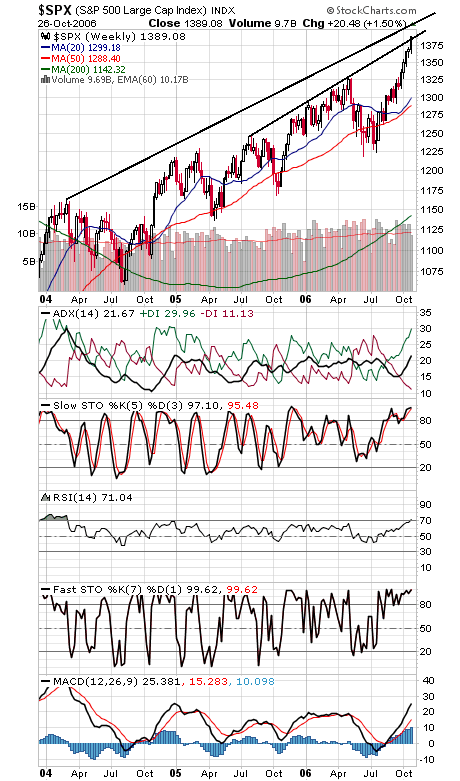
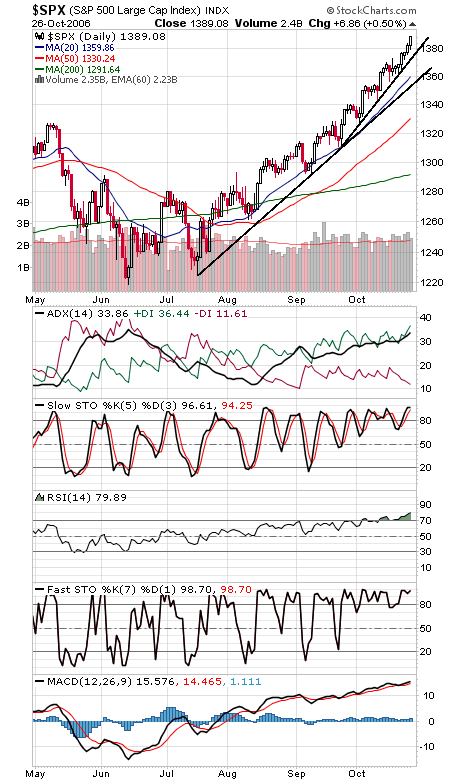
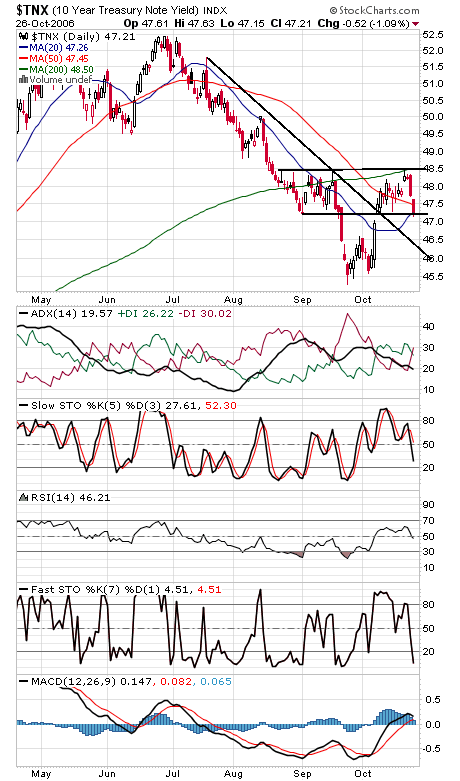
The Nasdaq (first two charts below) became the latest index to erase its summer swoon, in the process eliminating a negative divergence that was threatening to undo the rally. 2390-2400 and 2420-2425 are up next for the index, and support is 2375, 2358 and 2350. The S&P (third and fourth charts) is pushing through resistance here; next up could be 1400 and then 1420. Support on the S&P is 1382, 1375 and 1355. The Dow (fifth chart) is running up against rising resistance the last few days, and major support levels are 12,080, 12,000 and 11,875. Finally, after looking like they were putting in a major bottom, bond yields (sixth chart) may catch traders looking the wrong way here.


Recommended for you...

U.S. Needs to Protect Tech Leadership: Qualcomm
Rob Enderle
Apr 8, 2022
HP’s ExtendXR Service Gets an Early Lead on a Looming Metaverse Problem
Rob Enderle
Mar 5, 2022
Cisco’s Purpose Is to Improve the World. Imagine if Others Followed.
Rob Enderle
Dec 17, 2021
HP Builds an Advanced Cloud Workstation for the Metaverse
Rob Enderle
Nov 13, 2021
Internet News Logo

InternetNews is a source of industry news and intelligence for IT professionals from all branches of the technology world. InternetNews focuses on helping professionals grow their knowledge base and authority in their field with the top news and trends in Software, IT Management, Networking & Communications, and Small Business.

Property of TechnologyAdvice. © 2025 TechnologyAdvice. All Rights Reserved

Advertiser Disclosure: Some of the products that appear on this site are from companies from which TechnologyAdvice receives compensation. This compensation may impact how and where products appear on this site including, for example, the order in which they appear. TechnologyAdvice does not include all companies or all types of products available in the marketplace.