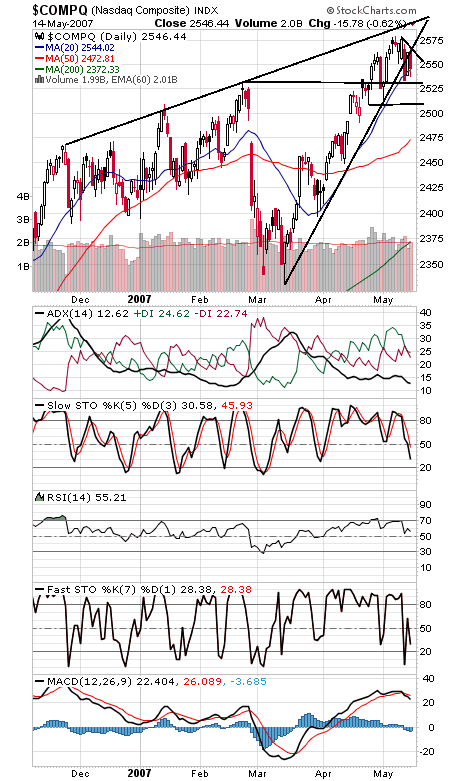
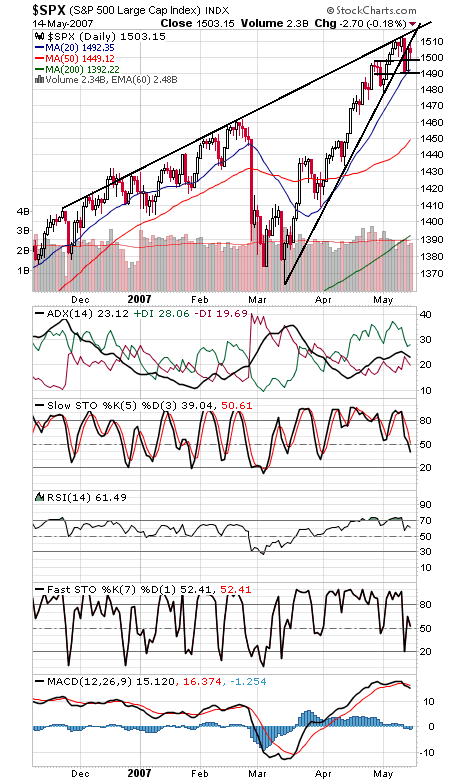
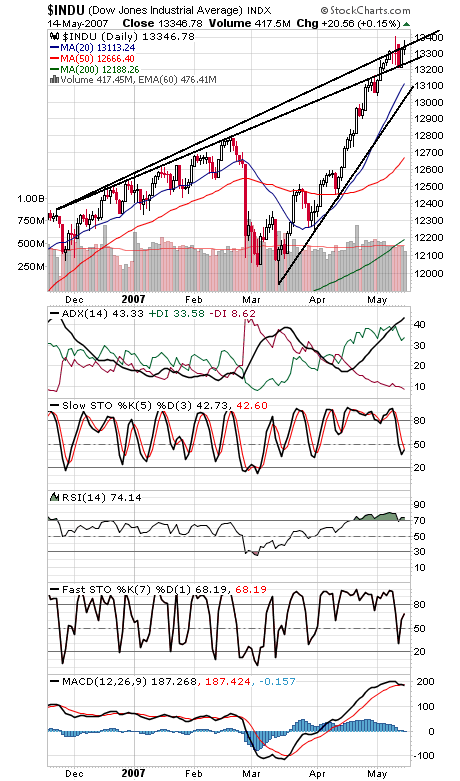
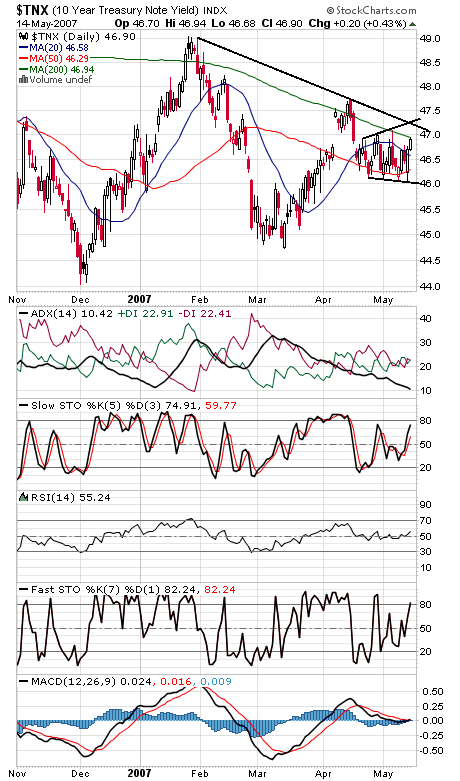
The Nasdaq (first chart below) is back in its familiar position of laggard after Friday’s sell signal under Gerald Appel’s Nasdaq/NYSE relative strength indicator. Some slight complacency has begun to creep into options indicators, but in general, we expect the path of least resistance to be up for the next couple of months. The Nasdaq faces resistance at 2565-2570, 2580 and 2595, and support is 2532 and 2500-2510. The S&P (second chart) faces tough resistance at 1513-1516, and support is 1498-1500, 1493 and 1490. The Dow (third chart) is running into some resistance at 13,400, and 13,250 is support. Bond yields (fourth chart) look set up for a breakout, but we’ll how they respond to tomorrow’s inflation data.


