Technical Analysis: Techs Hang On | Internet News

Technical Analysis: Techs Hang On

Written By
Paul Shread
Paul Shread
Jan 24, 2006
1 minute read


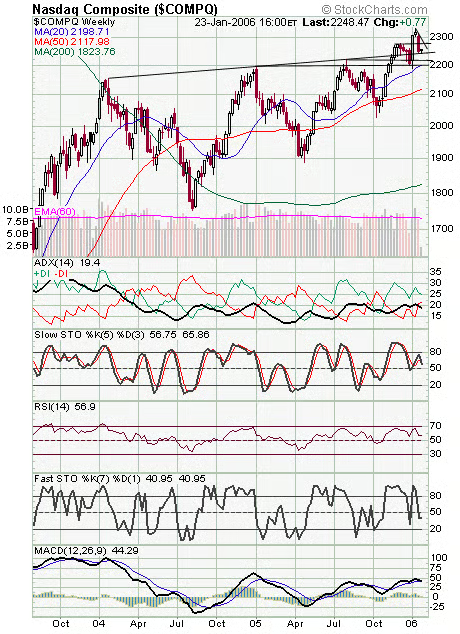
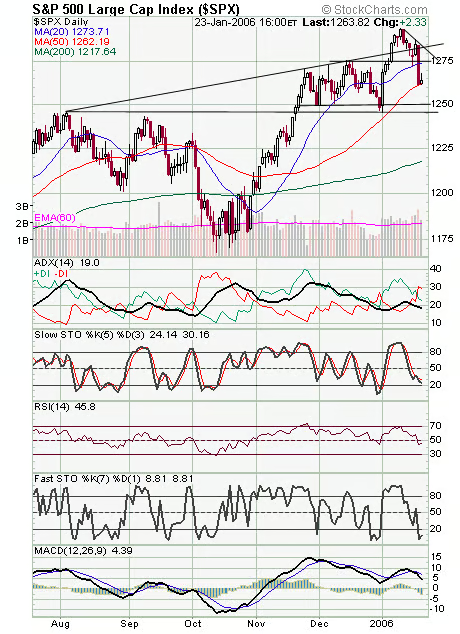
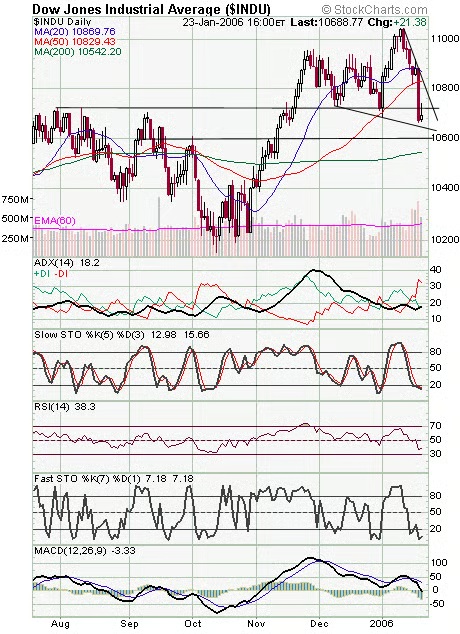
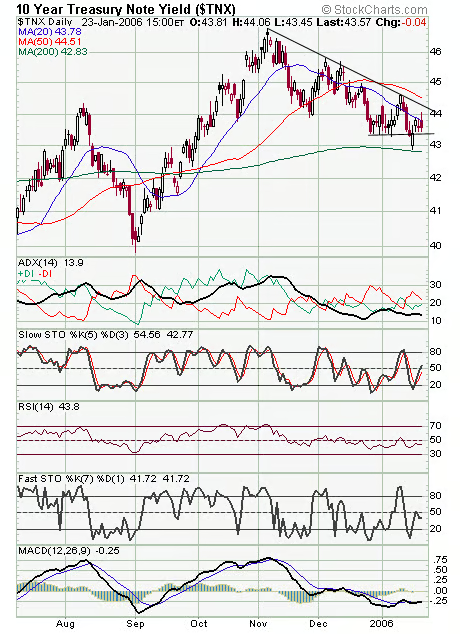
The Nasdaq (first chart below) is hanging on to the critical 2240 support level; if that goes, 2230, 2220 and 2190-2200 are possible targets. To the upside, 2256, 2264, 2278 and 2290 are resistance. The S&P (second chart) is hanging on to 1262 support, with the major support level of 1246-1250 below that. Resistance is 1270-1275 and 1284. The Dow (third chart) has support at 10,640, 10,600 and 10,540, and resistance is 10,720-10,750 and 10,800-10,830. Long bond yields (fourth chart) remain in a downtrend, so that’s a plus.


Internet News Logo

InternetNews is a source of industry news and intelligence for IT professionals from all branches of the technology world. InternetNews focuses on helping professionals grow their knowledge base and authority in their field with the top news and trends in Software, IT Management, Networking & Communications, and Small Business.

Property of TechnologyAdvice. © 2026 TechnologyAdvice. All Rights Reserved

Advertiser Disclosure: Some of the products that appear on this site are from companies from which TechnologyAdvice receives compensation. This compensation may impact how and where products appear on this site including, for example, the order in which they appear. TechnologyAdvice does not include all companies or all types of products available in the marketplace.