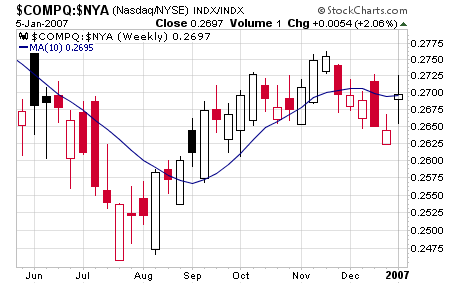
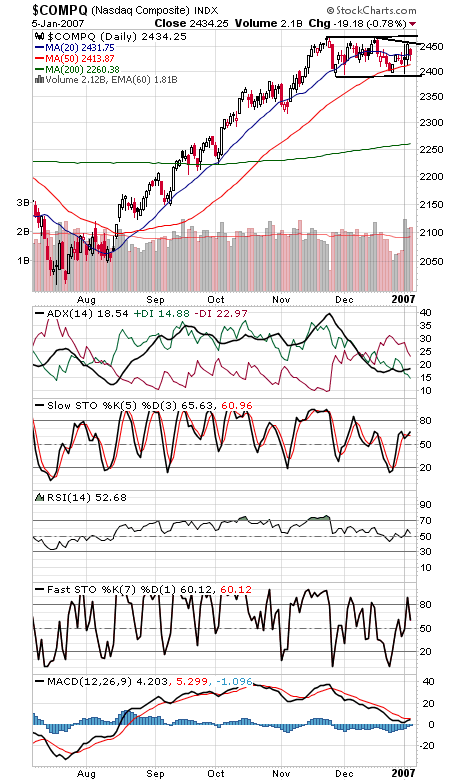
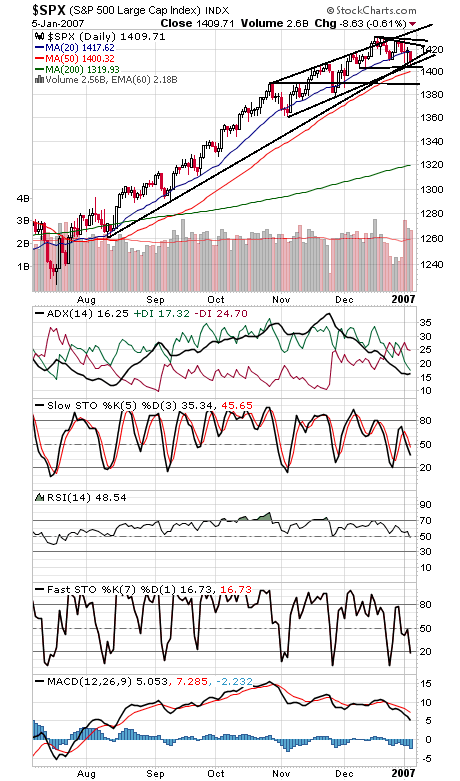
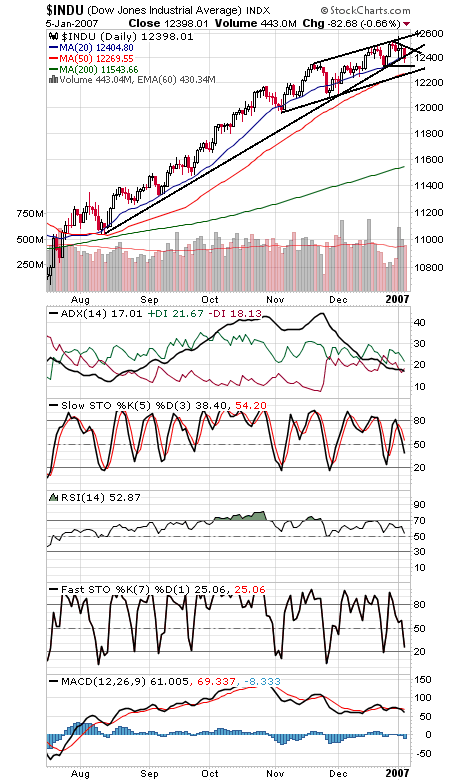
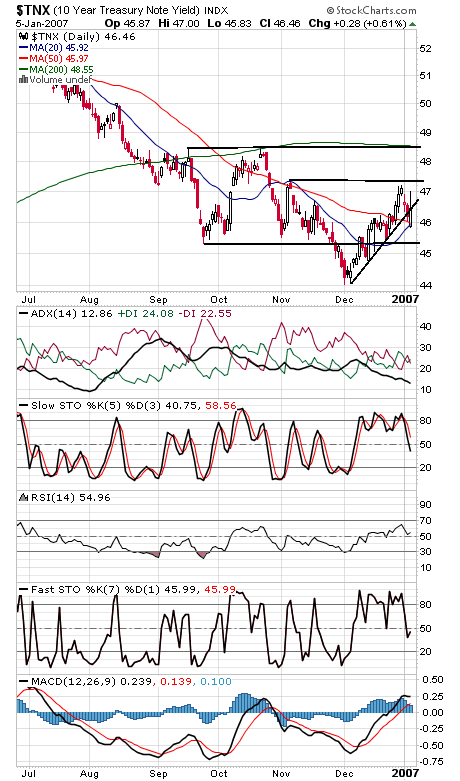
It wasn’t pretty, but the Nasdaq maintained its outperformance just enough today to generate a buy signal on Gerald Appel’s 10-week Nasdaq/NYSE relative strength indicator (see first chart below). Of course, stocks need to turn up from here to turn that buy signal into a profit; it’s not much good holding an outperforming sector if it’s just falling less than the rest of the market. And if the first five trading days of January are a barometer for the rest of the year, they need to turn up soon. 2415-2420 is first support on the Nasdaq (second chart), and 2455 and 2471 are resistance. The S&P (third chart) held onto support today, but not by much. 1403-1405, 1400 and 1390 are possible supports for the S&P, and resistance is 1418, 1422-1424 and 1429-1432. The Dow (fourth chart) is looking a little wobbly. Support is 12,340 and 12,280, and 12,430, 12,480-12,500 and 12,560-12,580 are levels to beat to the upside. Bond yields (fifth chart) found support at a couple of moving averages and turned back up today. Finally, a look at the 2007 picks for Ken Lee’s Trouncing the Dow system. The 2006 picks lagged the market with a 9.3% return, but any system that achieved positive returns from 2000-2002 is worth keeping an eye on.