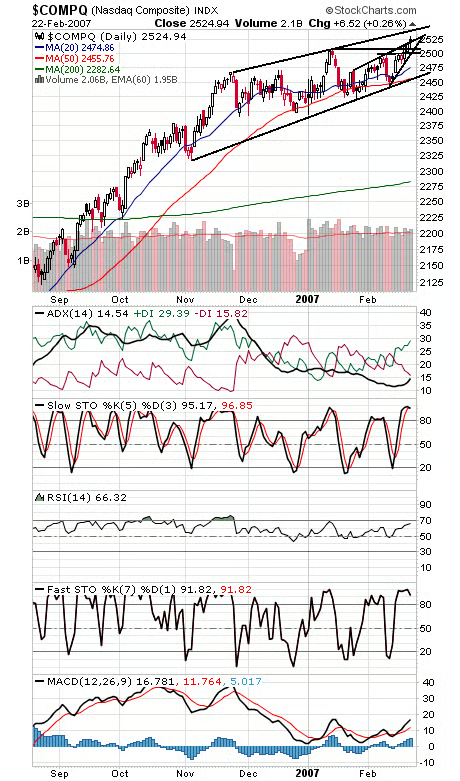
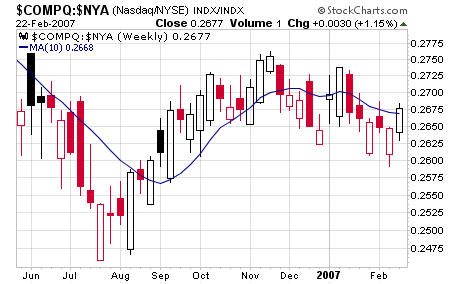
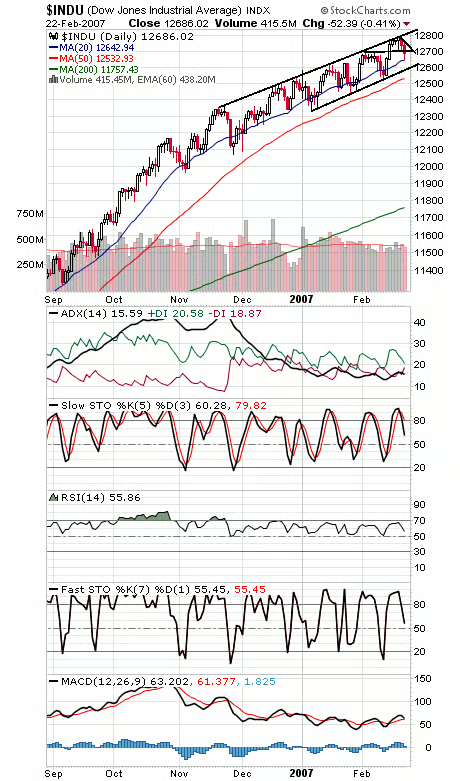
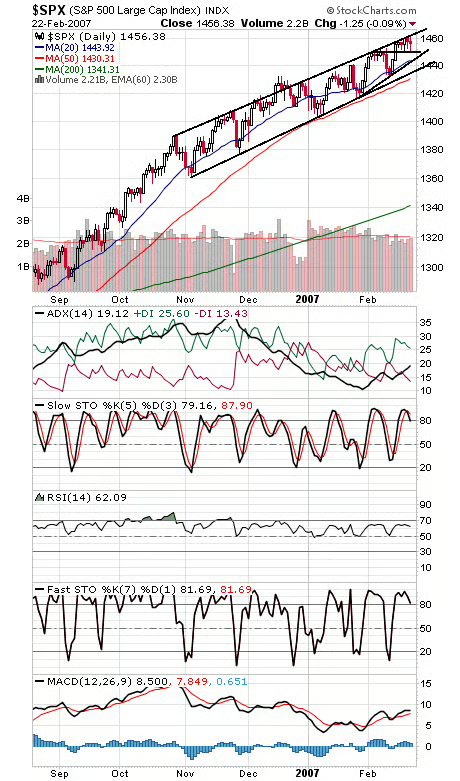
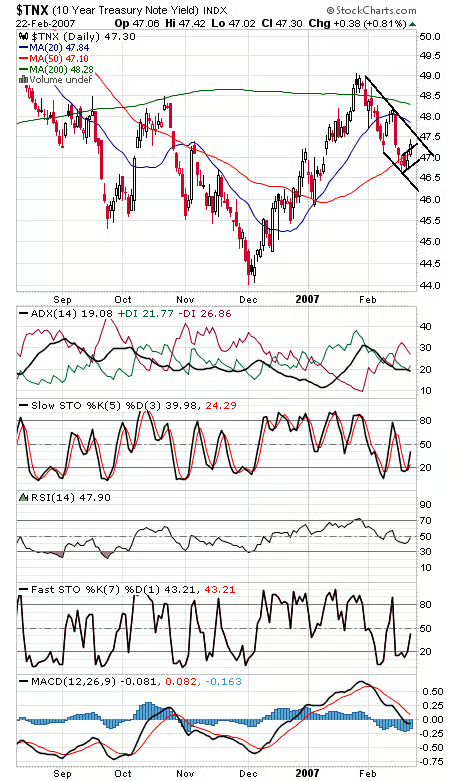
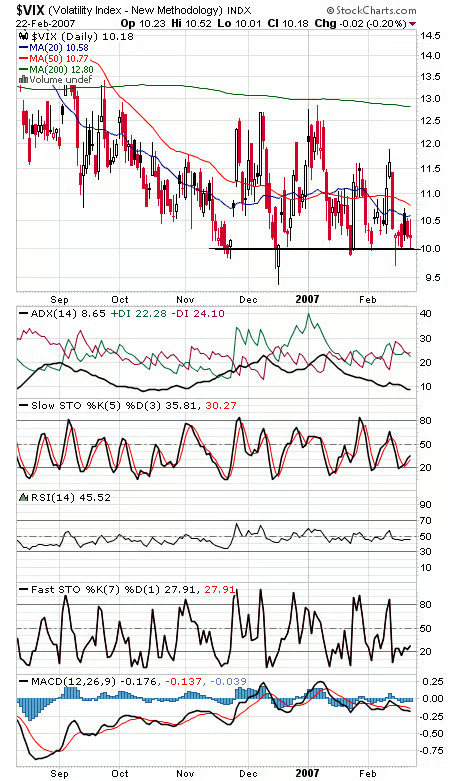
The Nasdaq (first chart below) appears ready to close out the week with a buy signal, just in time for end-of-the-month inflows. The index barely has to keep pace with the NYSE tomorrow to register a buy signal under Gerald Appel’s 10-week Nasdaq/NYSE relative strength indicator (second chart). That’s a good sign for the market in general, but with the Nasdaq putting in a doji star today (a sign of hesitation) and the Dow (third chart) lagging here, we wouldn’t be surprised to see the blue chips play some catch-up here. Still, the techs had enough strength to take out a month-old rising resistance line today, so they could continue higher. 2550 looks like the next big resistance for the Nasdaq, and 2500-2509 remains support. The Dow gave up support at 12,700 today. 12,643 and 12,600 (a biggie) are the next support levels, and 12,740 and 12,820 are resistance. The S&P (fourth chart) continues to stall out at the rising upper channel line that has capped rallies since November. First support is 1449-1450, and resistance is 1463-1464. Bonds yields (fifth chart) have once again confounded expectations. Let’s see how they handle their main downtrend line at 4.76%; above that and yields may have turned back up. And finally, a look at the VIX (sixth chart), the options volatility index. The 10 level has been a tough one for that index in recent months; perhaps it’s time for fear gauges to pick up a little?