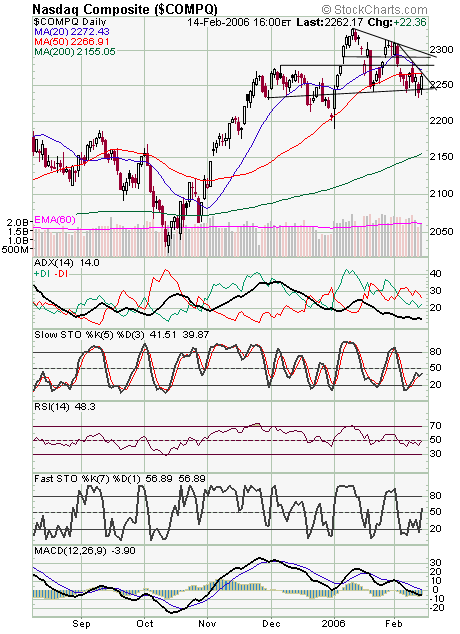
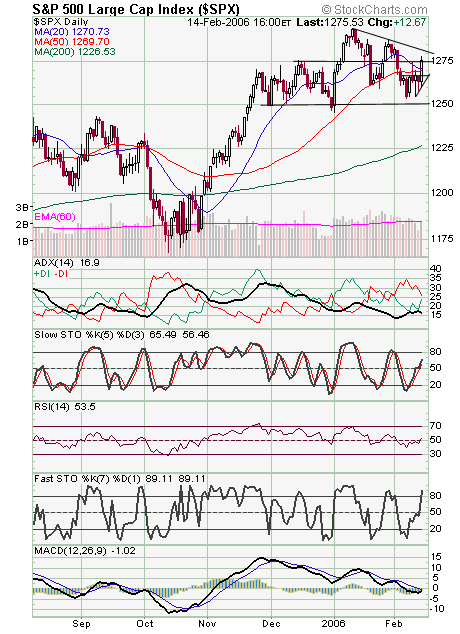
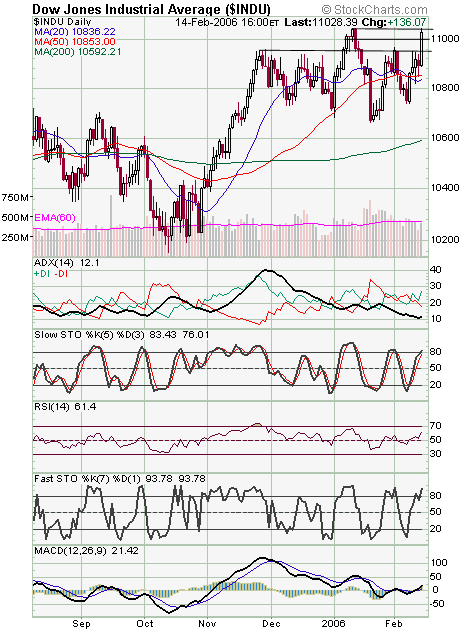
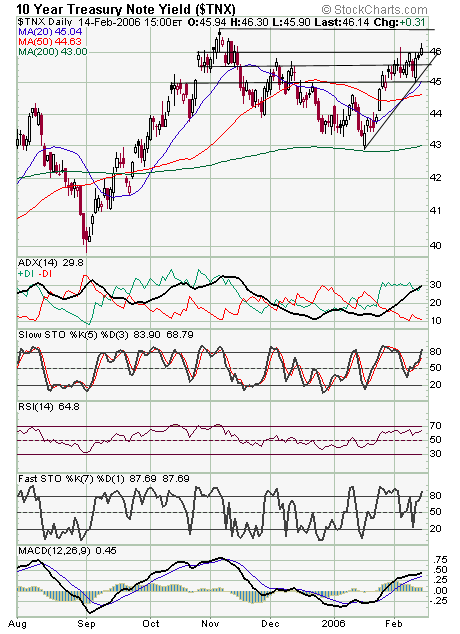
The Nasdaq (first chart below) recovered from yesterday’s close below its multi-year trendline at 2245, which remains critical support, with 2230-2232 the next level below. Resistance is 2267, 2280, 2290 and 2297-2300. The S&P (second chart) has support at 1270 and 1263, and resistance is 1282 and 1290. The Dow (third chart) continues to lead here, with its multi-year high just ahead at 11,070, and support at 11,000 and 10,960. On the other hand, long bonds (fourth chart) continue to provide zero support here.


