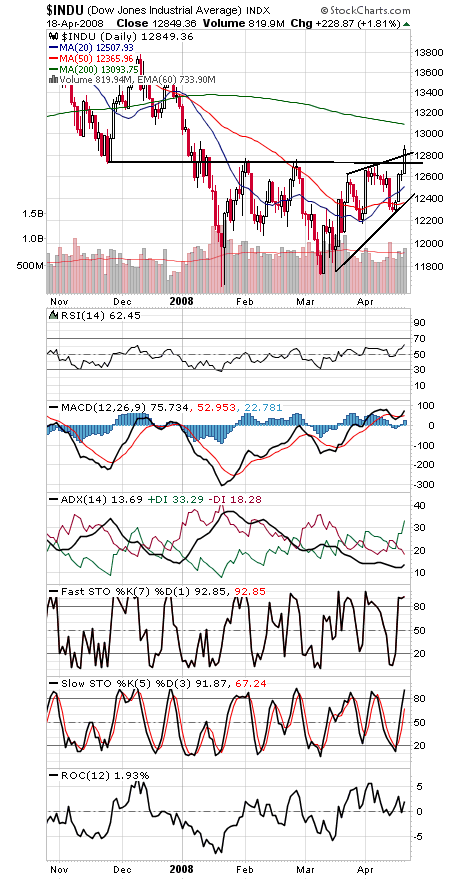
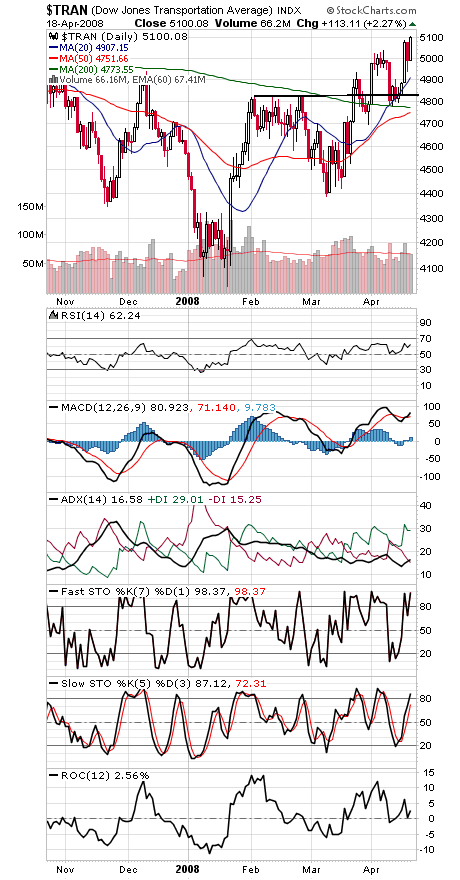
The Dow (first chart below) finally cleared 12,743.2, confirming the Transports’ (second chart) higher high and generating a Dow Theory bull signal, the first since mid-2003.
November’s bear signal wound up producing a 50-point loss in Dow points, but since the market fell 10% after that bear signal, it’s hard to call it a failure. It certainly correctly predicted an economic slowdown, which is how Dow Theory was originally intended.
With a greater than 90% winning record on Dow Theory bull signals, the burden of proof has certainly shifted to the bears at this point, as the market is suggesting the worst of the credit crunch is behind us.
13,100 looks like the Dow’s next test, and 12,750 its first support level, with 12,600, 12,500 and 12,400 below that.
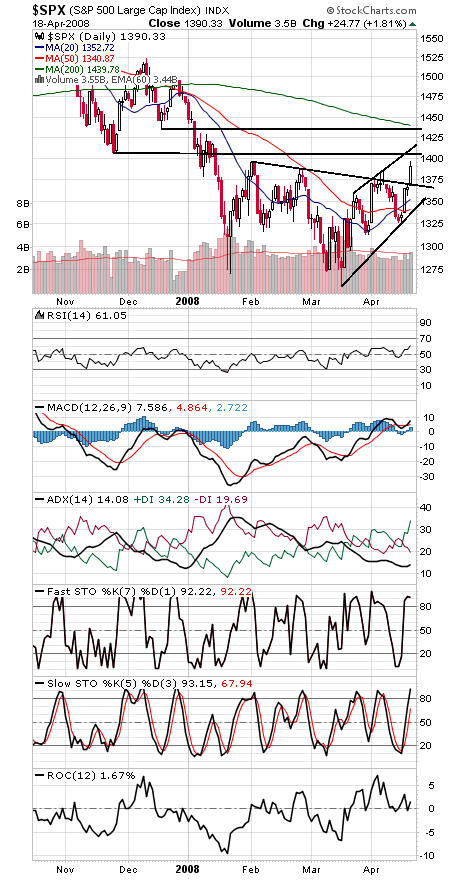
The S&P (third chart) still needs to clear 1406, with 1415 and 1435 above that, and support is 1370 and 1340.
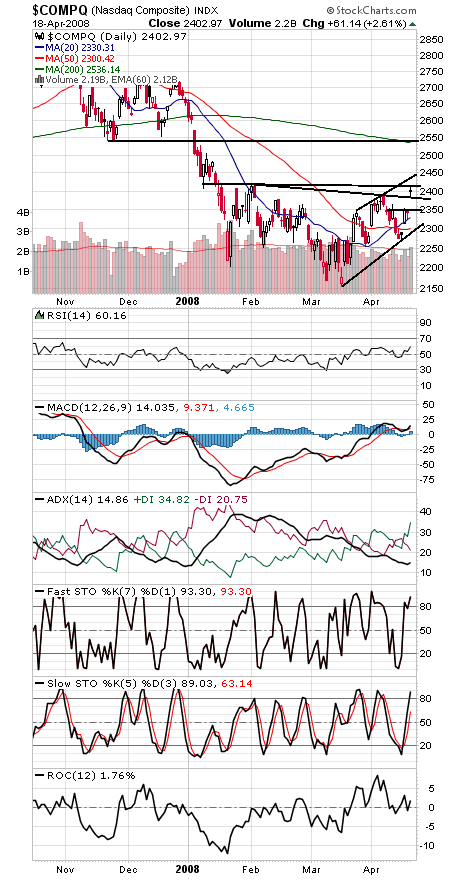
The Nasdaq (fourth chart) could tack on another 100 points if it can clear 2419 and 2440, and support is 2380, 2350 and 2300.
Paul Shread is a Chartered Market Technician (CMT) and member of the Market Technicians Association.


