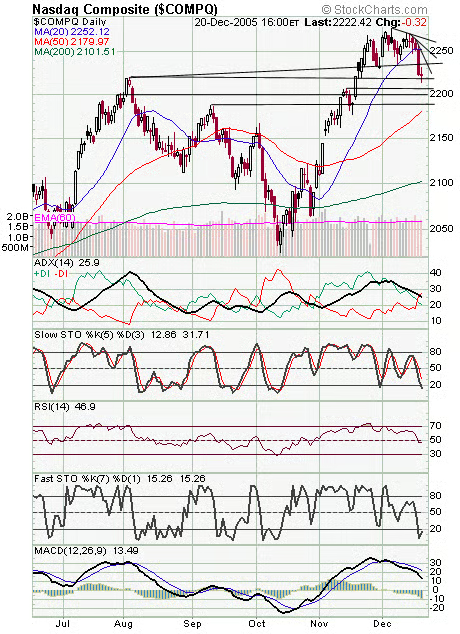
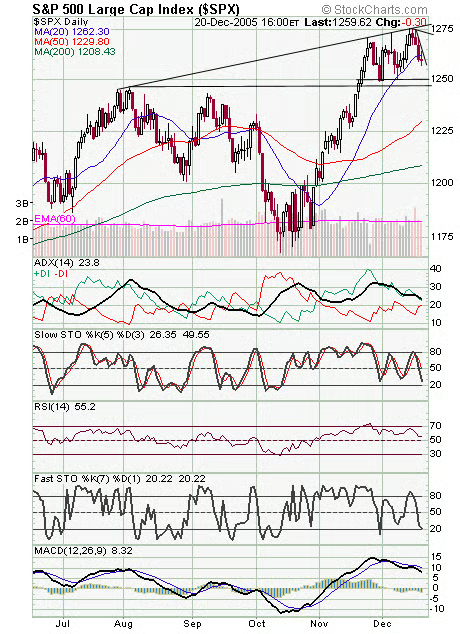
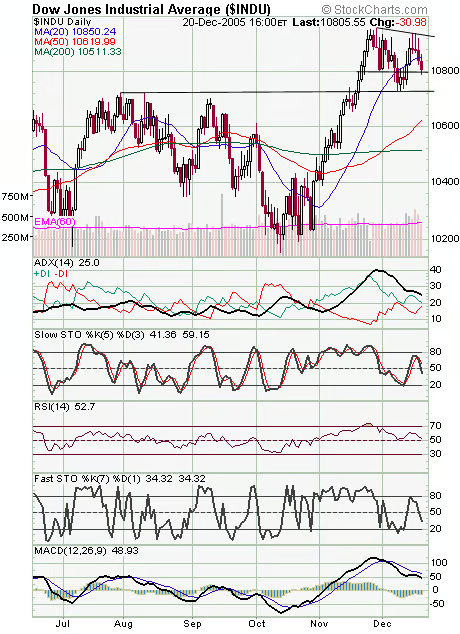
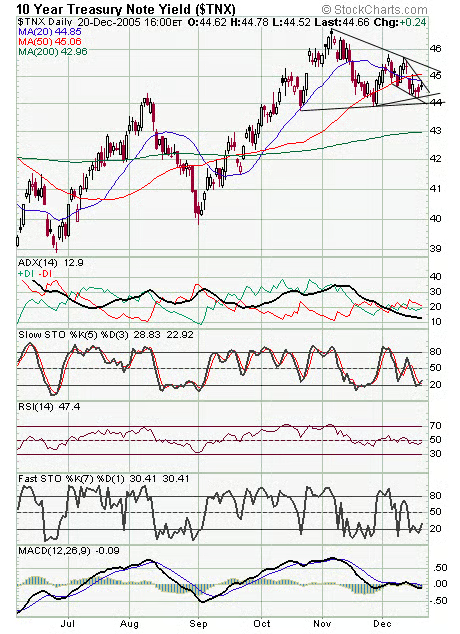
The short-term downtrend paused today; can stocks turn back up for their traditional year-end rally? The Nasdaq (first chart below) will have to get back above its multi-year resistance line at about 2232-2237 for that to happen. Support on the index is 2213, 2206 and 2200. The S&P (second chart) faces first resistance at 1262, and 1277-1282 is major resistance. Support is 1250 and 1246. The Dow (third chart) must clear that stubborn 10,950-11,000 resistance zone, and support is 10,720-10,750. Long bonds (fourth chart) remain very much range-bound here.