Note: The Technical Analysis column will return on Friday.
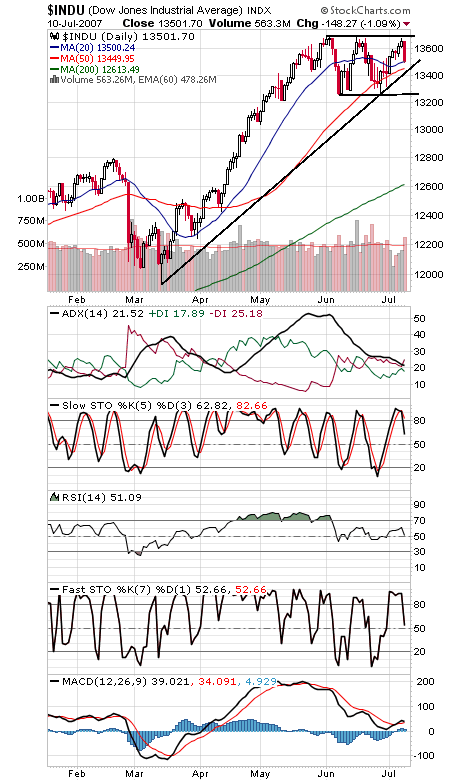
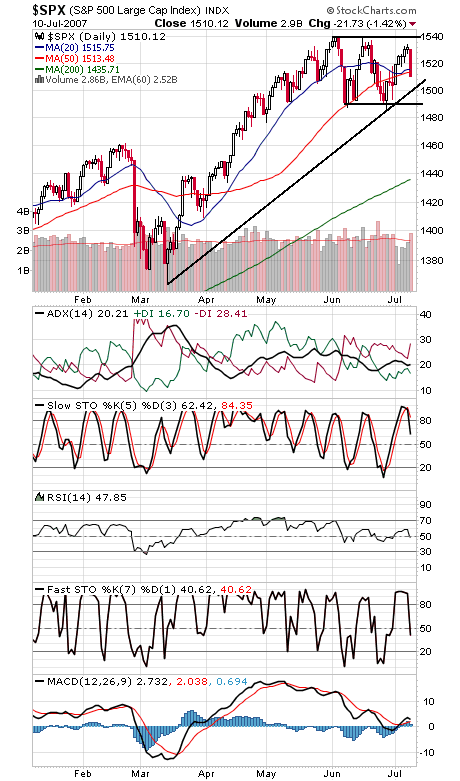
The S&P’s all-time intraday high of 1552.87 remains a huge obstacle for the market. On one hand, it’s a positive that the market hasn’t staged a wholesale retreat from these levels, but that could also be holding the market back — we haven’t had enough of a washout yet to clear out sellers here, and as you can imagine, there is a lot of overhead supply here. The big trading ranges that the Dow and S&P are in (first two charts below) are key to the market’s next big move — whichever way those ranges break, a sizeable move will likely follow. That makes 1540 and 1484 on the S&P and 13,692 and 13,251 on the Dow critical levels for the market. 1500 and 13,450 are important first supports for the indexes.
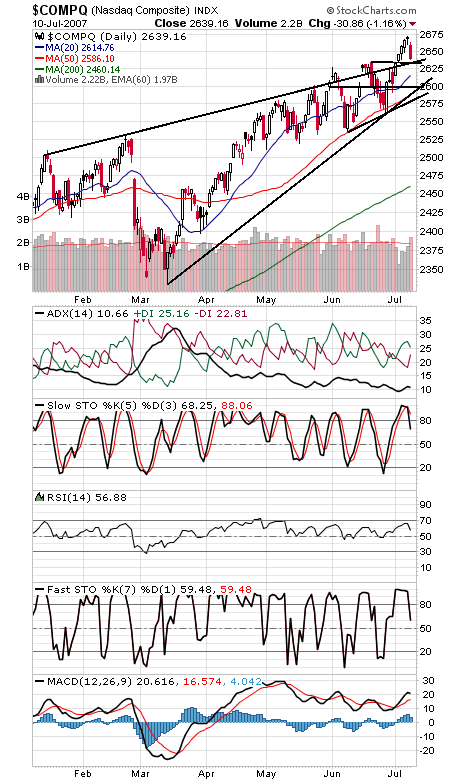
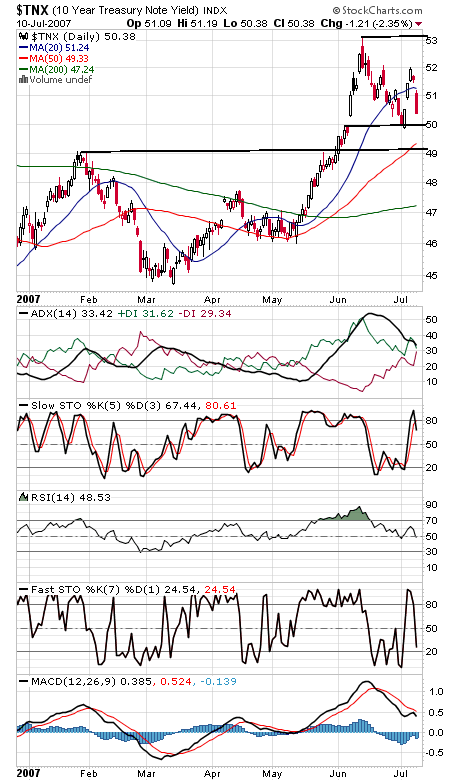
The Nasdaq (third chart) remains a bright spot for the bulls, since tech outperformance suggests a growing economy and investors willing to take risks. 2632-2635 is important first support on the Nasdaq; below that, 2590-2600 could come into play. 2658-2663, 2672 and 2680-2700 are resistance. The 10-year yield (fourth chart) remains stuck between 4.9-5.0% and the 5.25% neutral zone.
Paul Shread is a Chartered Market Technician (CMT) and member of the Market Technicians Association


