Technical Analysis: Tug of War Continues | Internet News

Technical Analysis: Tug of War Continues

Written By
Paul Shread
Paul Shread
Dec 14, 2006
1 minute read

Note: The Technical Analysis column will return on Monday, Dec. 18.


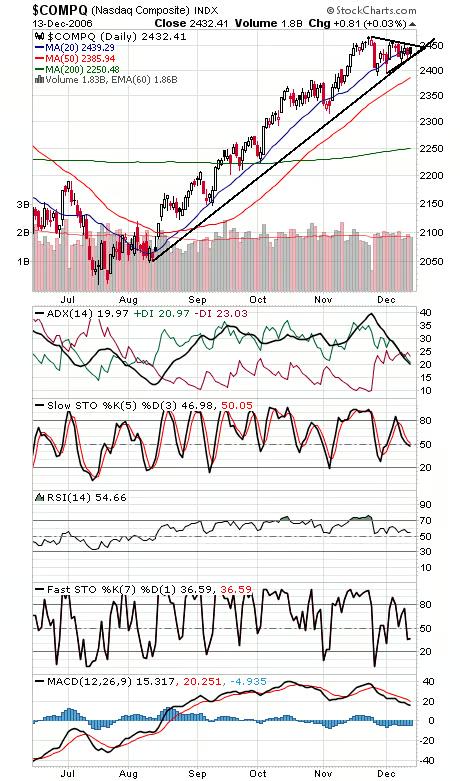
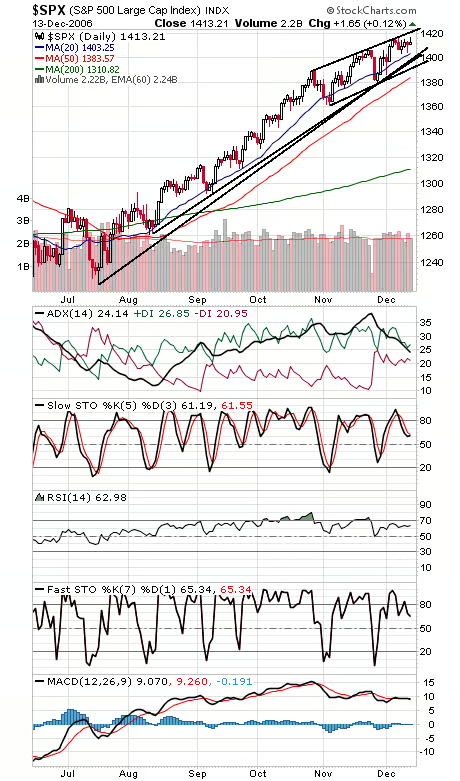
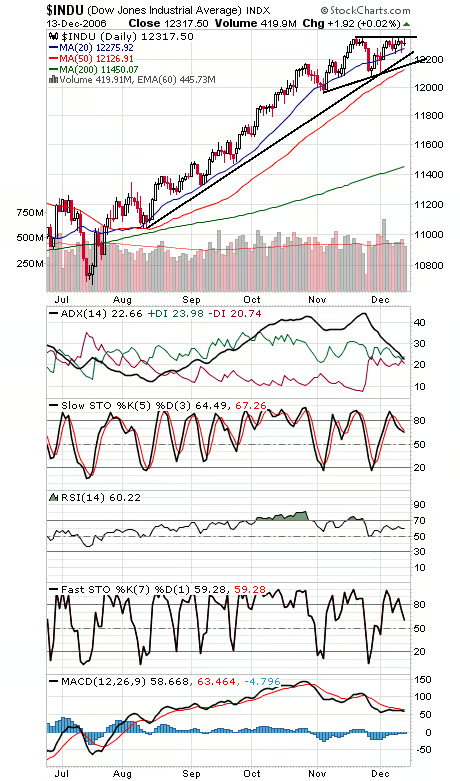
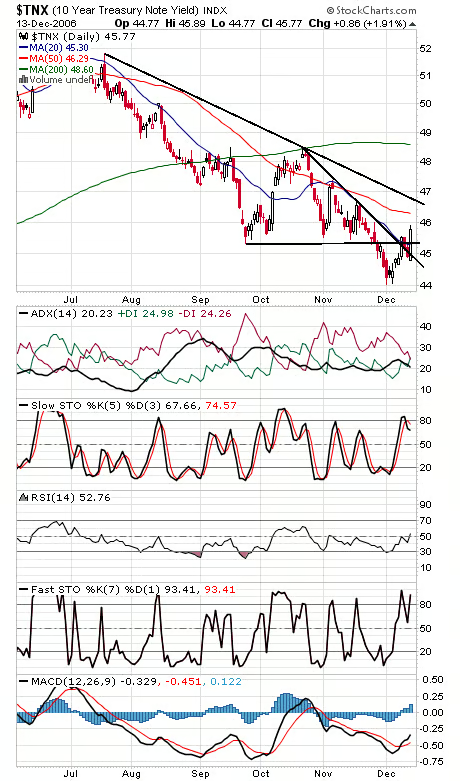
The bulls appear to be having as much trouble as the bears here, as the market continues to wind up in a tight range. The Nasdaq (first chart below) is range-bound between 2430 and 2450; a strong break of that symmetrical triangle should be worth a good move. The S&P (second chart) stalled just below its 52-week high of 1418, but 1422 is a more important resistance level, a trendline that’s been touched on nine trading days and counting. Support is 1411, 1404, 1398-1400 and 1392. The Dow (third chart) barely cleared 12,355-12,361 resistance before turning back at 12,368. Support is 12,285, 12,230-12,250 and 12,160. Bond bears (fourth chart) are having the most success they’ve had in some time.


Internet News Logo

InternetNews is a source of industry news and intelligence for IT professionals from all branches of the technology world. InternetNews focuses on helping professionals grow their knowledge base and authority in their field with the top news and trends in Software, IT Management, Networking & Communications, and Small Business.

Property of TechnologyAdvice. © 2026 TechnologyAdvice. All Rights Reserved

Advertiser Disclosure: Some of the products that appear on this site are from companies from which TechnologyAdvice receives compensation. This compensation may impact how and where products appear on this site including, for example, the order in which they appear. TechnologyAdvice does not include all companies or all types of products available in the marketplace.