Note: The Technical Analysis will be on hiatus next week and will return Monday, April 9.
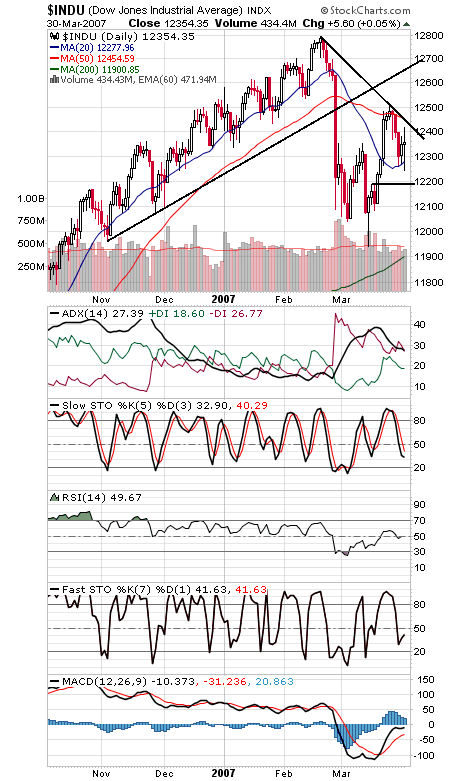
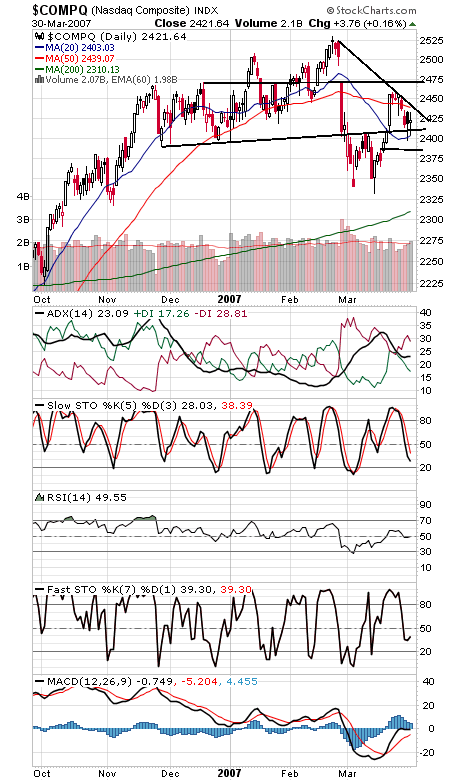
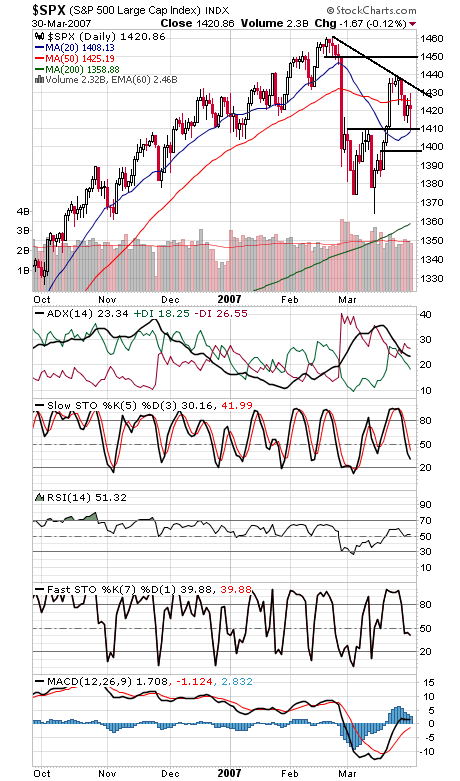
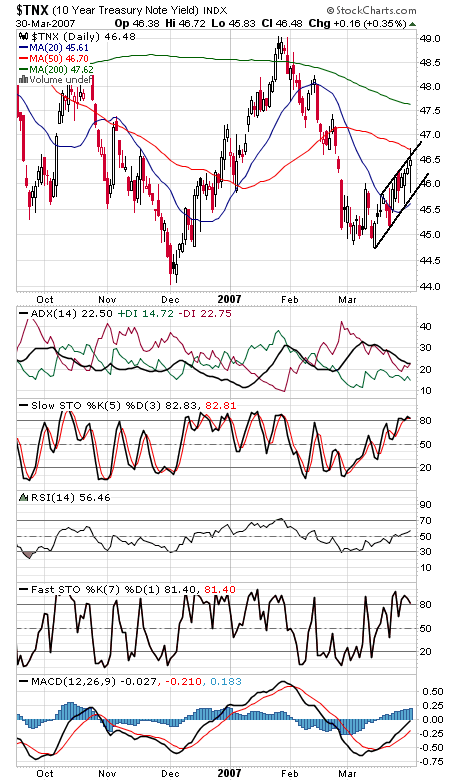
A tough end to a tough quarter, as all the indexes traded in a wide range during the quarter only to end it little changed. April tends to be a pretty positive month, though, and with market-positive sentiment, next month could follow form, but the bulls are going to have to right themselves first. So far we have a very choppy, overlapping rally, but at least we haven’t overlapped the initial leg up on this most recent rally attempt (12,190 on the Dow, 1397.5 on the S&P, and 2385 on the Nasdaq). If those levels go, we could be in for a complete retest of the lows. The Dow (first chart below) faces resistance at 12,440-12,450, 12,511 and 12,650-12,700. The Nasdaq (second chart) has first support at 2400-2410, and resistance is 2440, 2460 and 2471. The S&P (third chart) has first support at 1410, and resistance is 14225, 1430, 1433, 1440, 1445 and 1450. Bond yields (fourth chart) had interesting day, pushing up out of their rising channel but then running into resistance at the 50-day average. An exhaustion move or a sign of strength? Watch that lower channel line for the answer.


