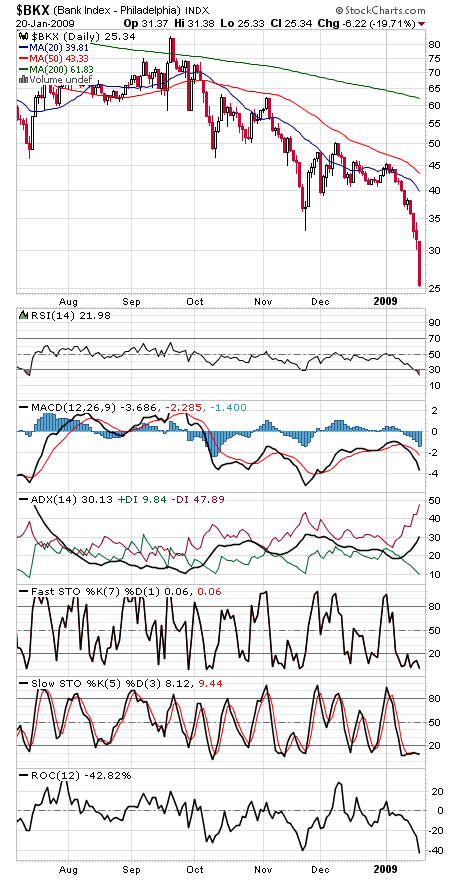
If President Obama wasn’t aware of the Herculean task he faces to try to right the economy, he certainly got a better sense of it today, as the bank sector (first chart below, at bottom) had its worst day since the late September meltdown that followed the failures of Lehman Brothers and AIG.
For the record, the bank stocks are now down 79% from their all-time high set a little less than two years ago. That’s now greater than the 78% decline suffered by the Nasdaq from 2000-2002, and getting closer to the 89% loss suffered by the Dow in the 1929-1932 bear market.
With the government owning more and more of the financials, it’s not hard to imagine that BKX chart getting even worse, as common stock in the banks is worth less and less with each new bailout round — and no end appears to be in sight.
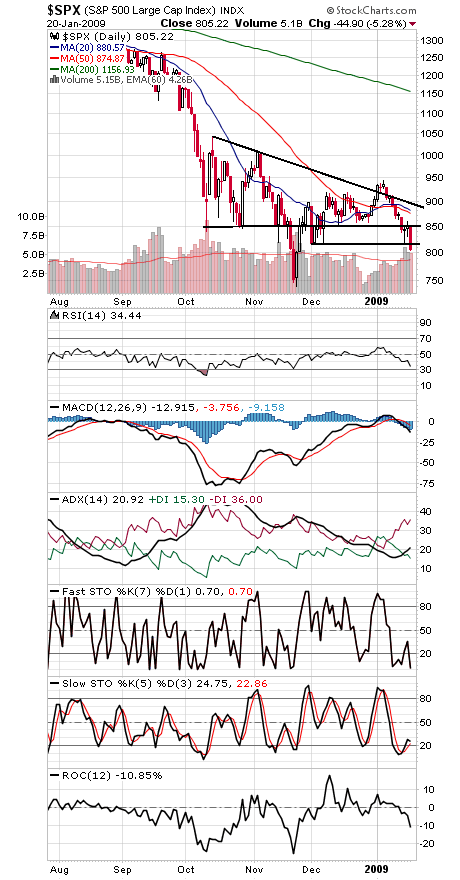
The rest of the market is holding up better, but the broad market indexes are threatening to go lower here too.
The S&P 500 (second chart) undercut 815 support today, setting up a possible retest of November’s 741 low. To the upside, a move above 850-858 would be a good start, with 875-880 and 900 the next hurdles above that.
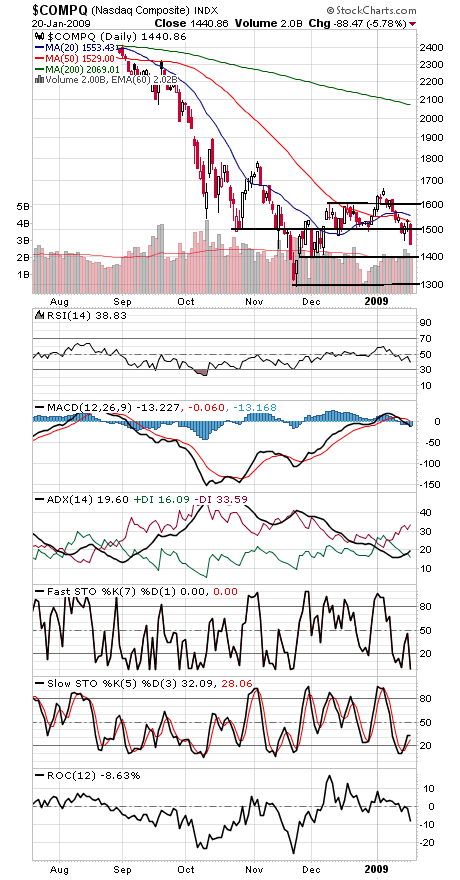
The Nasdaq (third chart) could be on its way to 1400. To the upside, 1500-1538 is strong first resistance.
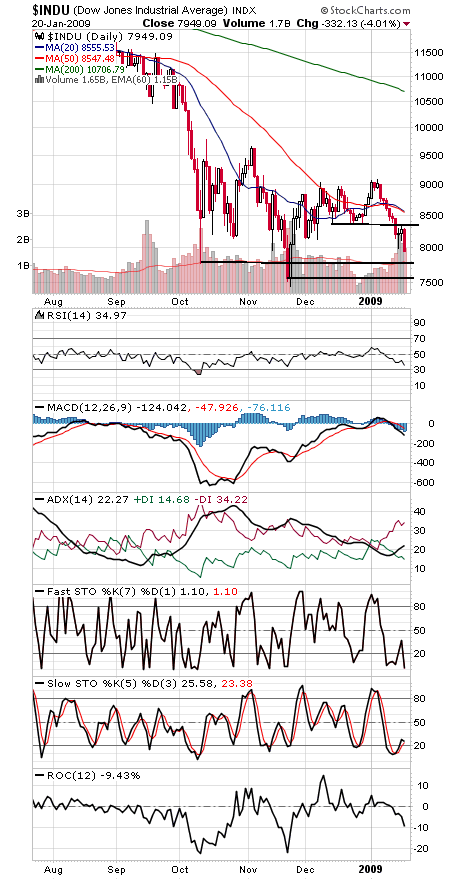
The Dow (fourth chart) has support at 7800-7880 and 7507, and 8350 and 8500 are resistance.
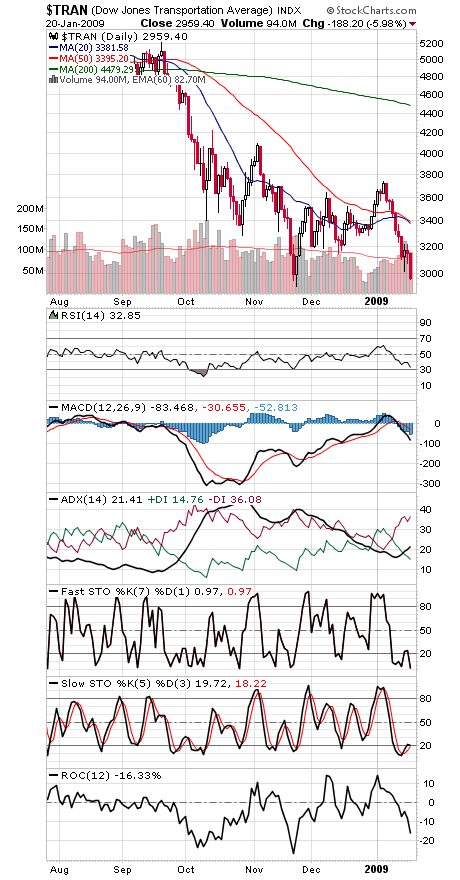
And the Dow’s counterpart, the Transports (fifth chart), set a new closing low today, making the Dow’s 7507 closing low a very important support for the market.
Paul Shread is a Chartered Market Technician (CMT) and member of the Market Technicians Association.
