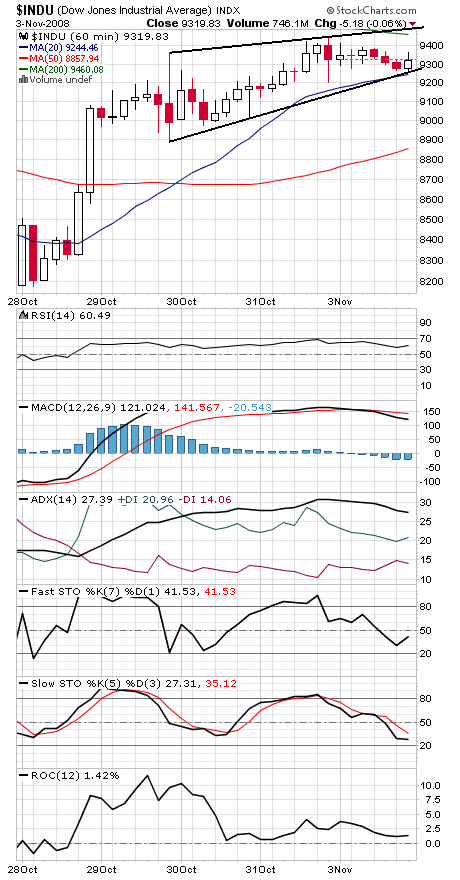
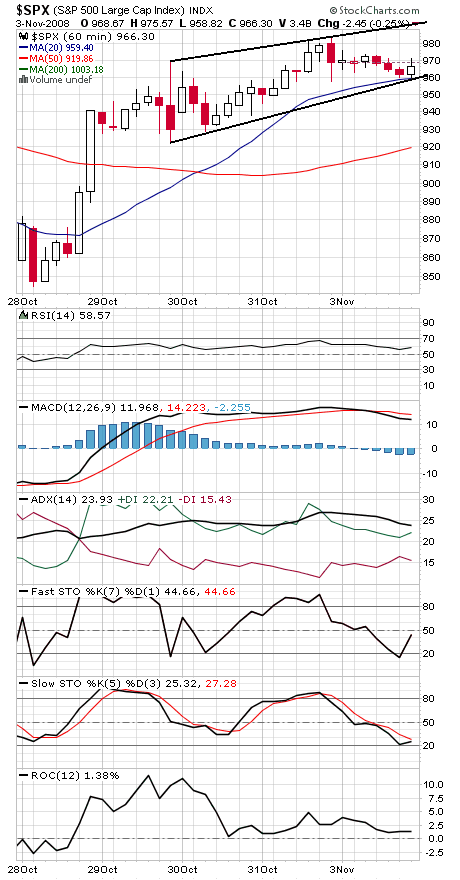
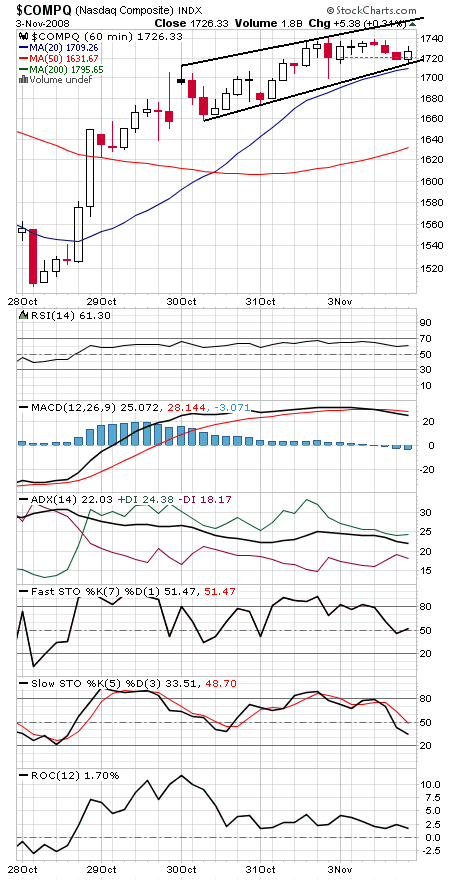
The wide trading ranges we discussed last week remain very much in play, but the choppy action of the last four days could portend a big move in the short term.
The indexes all appear to be forming ‘rising wedges’ or ‘ending diagonals’ in the last four days, patterns clearly visible on the hourly chart (see below). Such patterns, with slowly converging trendlines, suggest that the rally will soon run out of room and will have to decide which way it’s going to break.
Such patterns are normally bearish — but a break up through the top of those patterns could catch a lot of traders looking the wrong way and lead to a good rally.
The levels to watch on the Dow (first chart below) are 9500 to the upside and 9270 and rising to the downside. On the S&P (second chart), the levels are 995 to the upside and 960 to the downside, while the Nasdaq’s (third chart) hurdles are 1716 to the downside and 1750 above the market.
If they break down, the minimum downside for those patterns would be 8900, 922 and 1660, respectively — back to where they began.
Paul Shread is a Chartered Market Technician (CMT) and member of the Market Technicians Association.


