Technical Analysis: A Big Test for Techs | Internet News

Technical Analysis: A Big Test for Techs

Written By
Paul Shread
Paul Shread
Aug 4, 2006
1 minute read


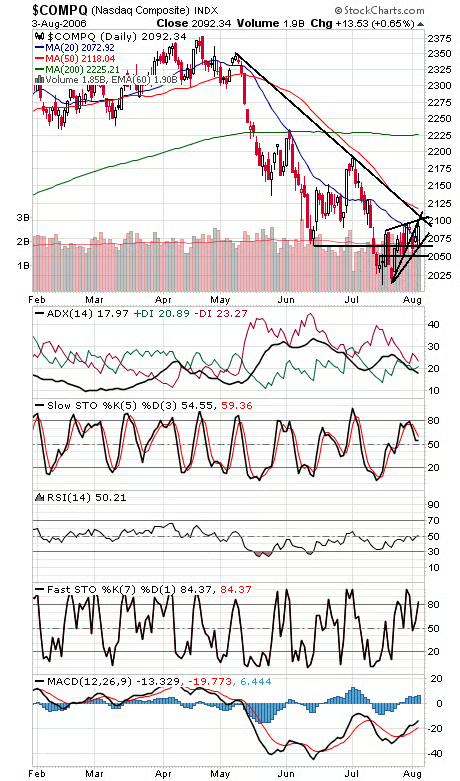
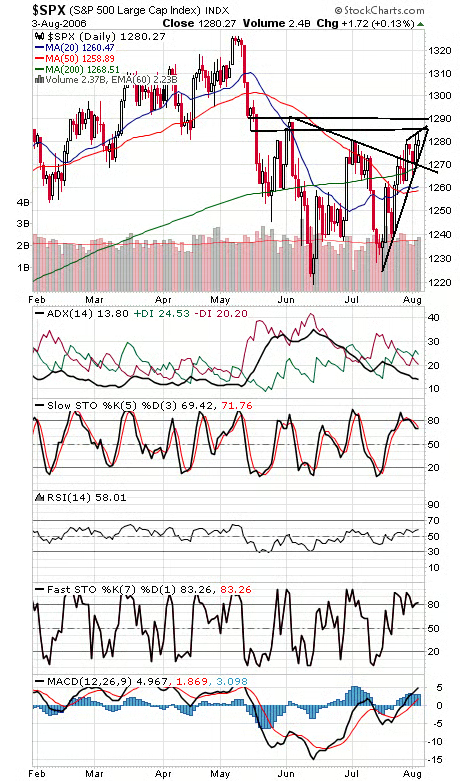
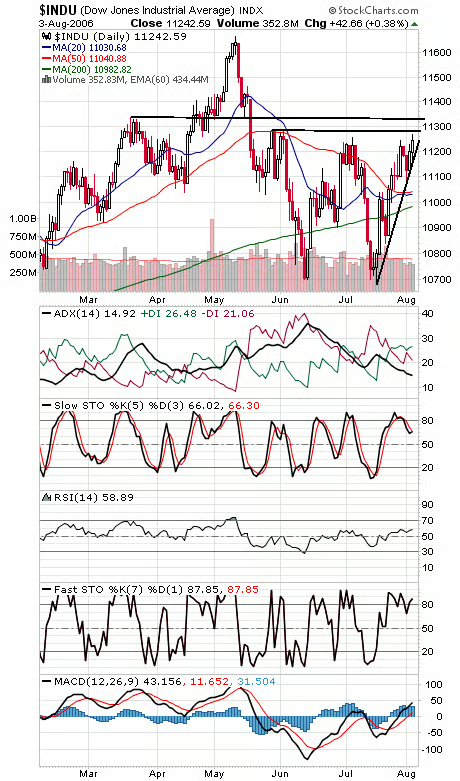
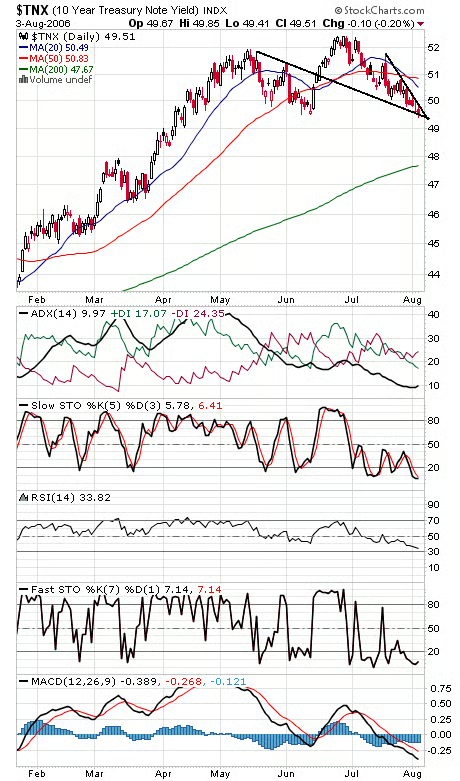
With internals continuing to erode and upside volume barely clearing 50% today, does the Nasdaq (first chart below) have what it takes to clear some major overhead resistance on tomorrow’s jobs report? 2100-2107 looks like tough resistance, with 2117 above that. Support is 2065-2070 and 2050. The S&P (second chart) faces tough resistance at 1285-1287 and 1291, and support is 1277 and 1269. The Dow (third chart) faces major resistance between 11,290 and 11,330, and first support is 11,200. Long bond yields (fourth chart) continue to creep lower, but remain wound in a very narrow pattern.


Internet News Logo

InternetNews is a source of industry news and intelligence for IT professionals from all branches of the technology world. InternetNews focuses on helping professionals grow their knowledge base and authority in their field with the top news and trends in Software, IT Management, Networking & Communications, and Small Business.

Property of TechnologyAdvice. © 2026 TechnologyAdvice. All Rights Reserved

Advertiser Disclosure: Some of the products that appear on this site are from companies from which TechnologyAdvice receives compensation. This compensation may impact how and where products appear on this site including, for example, the order in which they appear. TechnologyAdvice does not include all companies or all types of products available in the marketplace.