A forgettable week for the stock market, as first breakouts failed and now support.
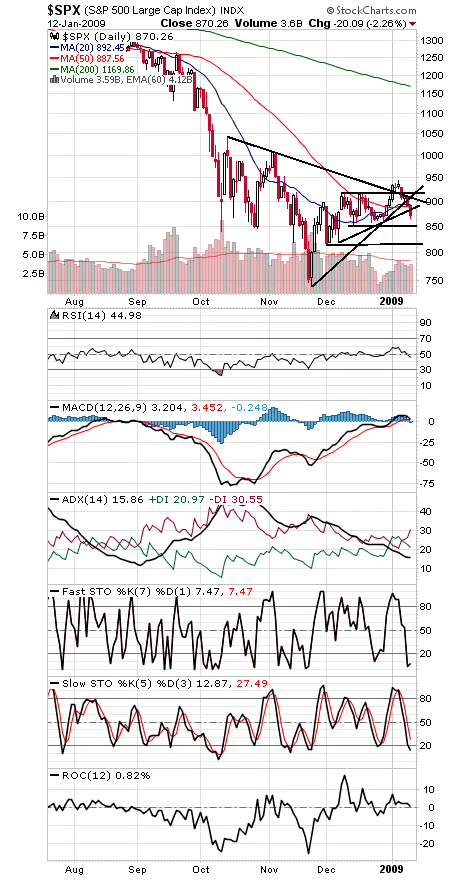
Take a look at the S&P (first chart below): after clearing a three-week trading range and downtrend line a week ago, the index has fallen back through both those levels — and has now violated any sense of an uptrend off the November lows. Not encouraging behavior.
850 is ideal support here; if that goes, 815 is the last support before the November lows are retested. To the upside, the index once again faces a mess of resistance between 887 and 920.
In the bigger picture, the index remains stuck in a wide trading range between 741 and 1044; is it consolidating before another leg down or bottoming?
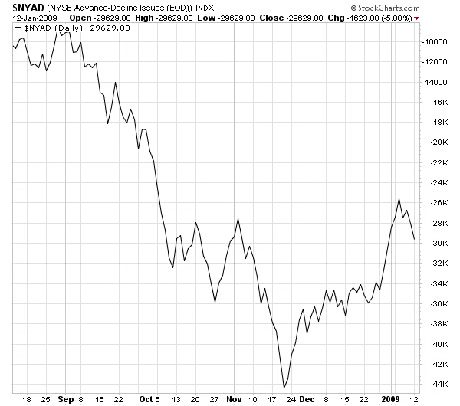
The evidence is mixed. On the plus side, we’d note significant improvement in risk spreads, signaling improvement in the credit markets, and an outperforming advance-decline line (second chart below). But we’d also note that sentiment has turned bullish quickly, hitting 42-34 bulls-bears in last week’s Investors Intelligence survey, a reversal from 54-22 bears-bulls less than two months ago.
The answer, as always, will be found in the charts — which so far remain stuck in neutral.
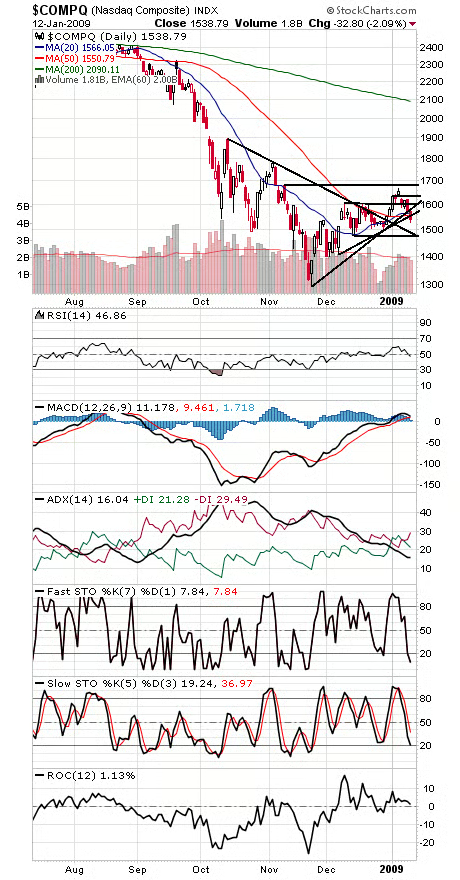
The Nasdaq (third chart) is holding up only slightly better. 1480 is critical support on the index, while resistance is 1551-1569, 1595-1603, 1617-1625 and 1665-1680.
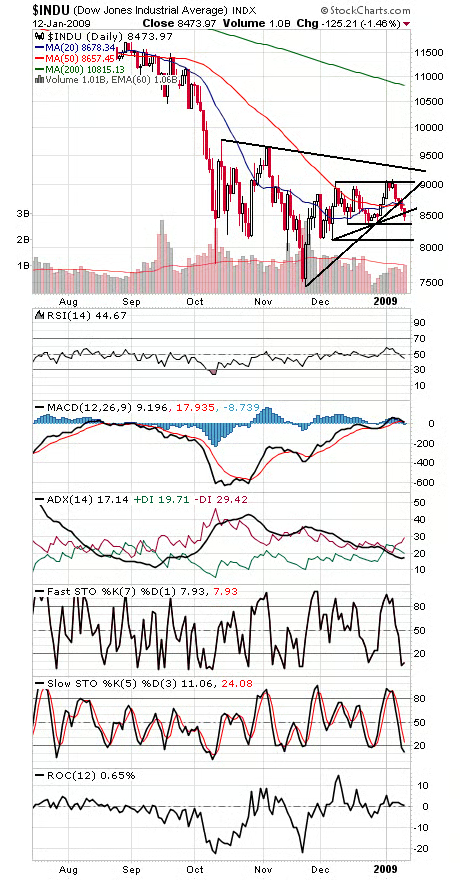
The Dow (fourth chart) has support at 8347 and 8118, and resistance is 8560, 8650, 8850 and 9000.
Paul Shread is a Chartered Market Technician (CMT) and member of the Market Technicians Association.