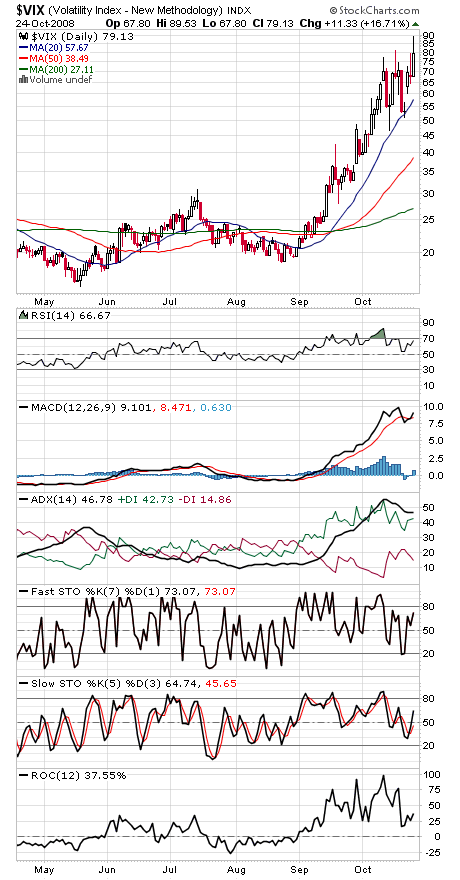
We’ll start with the positive: the third higher high in the VIX (the “fear index,” first chart below) since stocks bottomed two weeks ago.
That shows that investors are becoming progressively more afraid even though stocks have yet to make new lows. That’s a positive divergence for the bulls to build on — with the caveat that the more we hammer on support here, the more demand is being absorbed and the more likely the indexes are to hit new lows, as the Nasdaq did today.
On the bright side, seasonality turns positive as of Monday’s close, but so far no amount of positive data points have been enough to halt the forced liquidation.
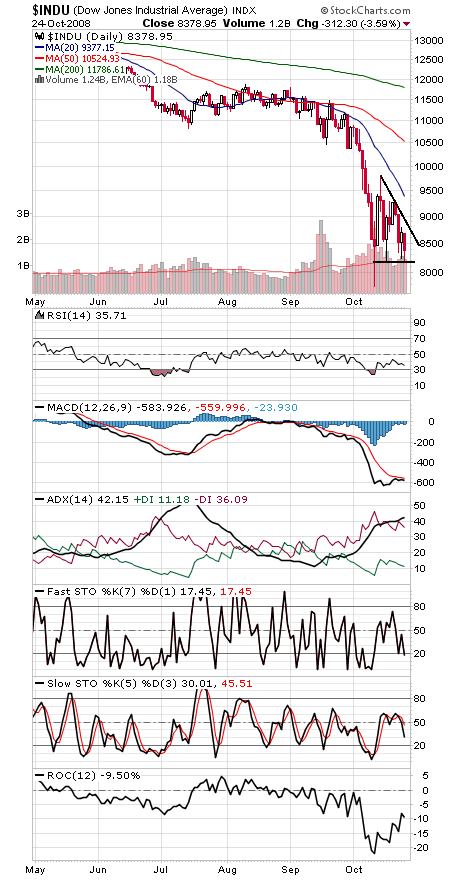
The Dow (second chart below) has support at 8187, 8000 and 7882 — and just below that is the 7500 area that has been strong support for about 11 years now. To the upside, resistance is 8500, 8800, 9043-9085, 9266-9281, 9311-9387 and 9794.
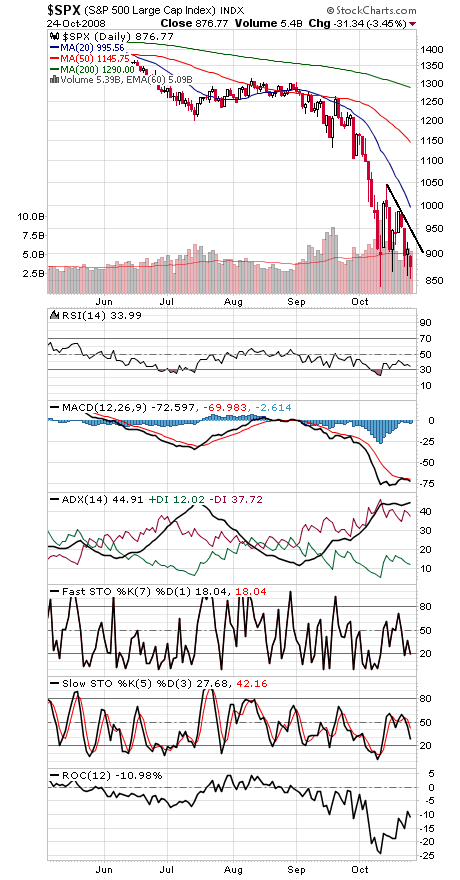
The S&P (third chart) is so far holding above its low of 839.8; below that and we could test the 2002 lows of 768-789. 852-865 is first support, and resistance is 896-900, 922, 935, 960, 985, 1000 and 1044-1060.
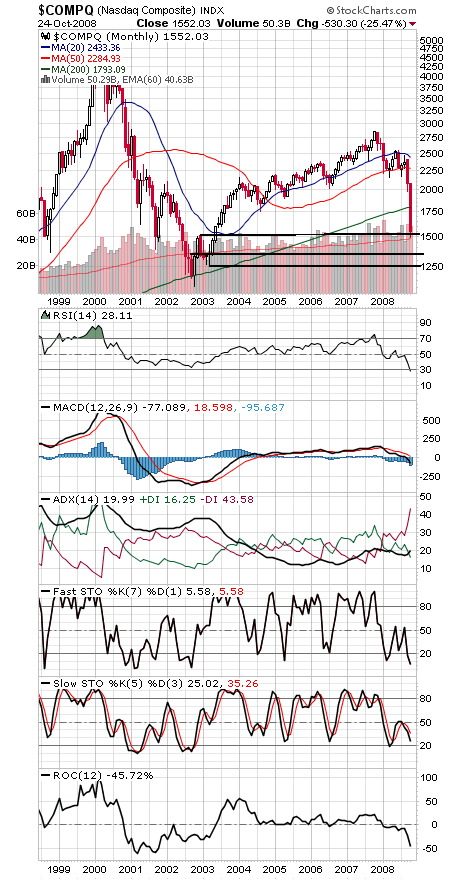
The Nasdaq (fourth chart) breached its late 2002 high of 1521 this morning before recovering. Below 1493, 1350 and 1250 could come into play. To the upside, resistance is 1584, 1645-1678 and 1782.
Paul Shread is a Chartered Market Technician (CMT) and member of the Market Technicians Association.