Sure, the government needs to rein in leverage, derivatives and hedge funds to prevent a recurrence of the systemic crisis enveloping the globe, but there are simpler steps the government can take right now that might take a little pressure off the stock market.
And the easiest of those steps would be to reinstate the “uptick rule,” which required that stocks could only be shorted when they were moving higher and stood for 69 years until the SEC eliminated it in July 2007 — just weeks before the start of the current crisis.
The SEC revoked the rule based on pilot studies in a bull market, but in a bear market, it sure looks like the absence of the rule has brought a return of the 1929-style “bear raids” it was designed to prevent. Shorts piling in on the way down can accelerate a decline, the SEC reasoned way back in 1938. It sure looks like that’s what we’re getting here.
But rather than revisit what appears to be a flawed decision, the SEC has instead resorted to enforcing naked short selling restrictions it should have been tougher on all along and banning shorting outright — which didn’t work when they tried it in 1931 and doesn’t seem to be working here either.
Rather than extend the short-selling ban — which expires tomorrow night — the SEC would do better to bring back the uptick rule and permanently ban naked short selling.
It’s a simple, long-term solution, and even the head of the NYSE favors it. Individual stock circuit breakers — which the SEC is reportedly considering — would likely not be as effective, as shorts could just wait and pile on for every new leg down.
The purpose of financial markets is for companies to raise money; there’s no reason why shorts need to be on an equal footing with longs.
And now on to the charts…
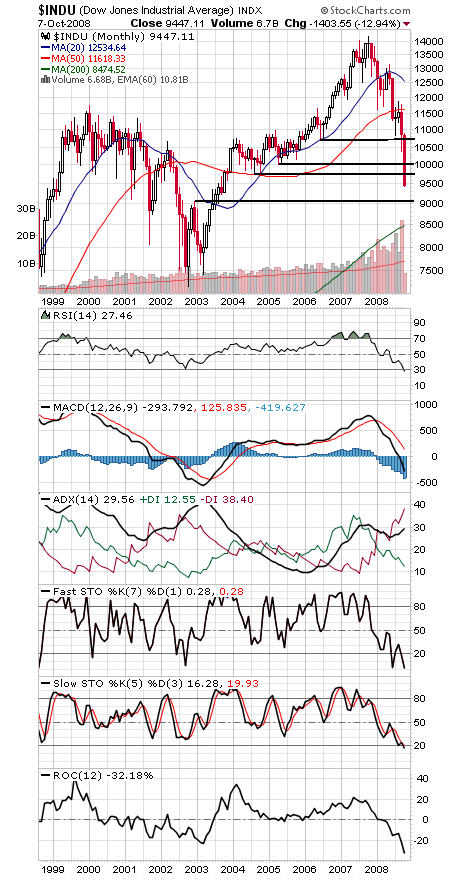
We warned weeks ago that a break of our major support level of 10,683 on the Dow (first chart below) could suggest a systemic crisis, and that’s exactly what we’re getting here.
The Dow has since given up 10,000 and 9700, which are now first resistance. The next support — and a very important one — is 9043.37, the top of the first leg up off the 2002 lows. Below that level and we could see a complete retest of the 2002 lows.
The S&P (second chart) faces the same support level at 954.28, with first support at 992. To the upside, 1060, 1111 and 1163 are resistance.
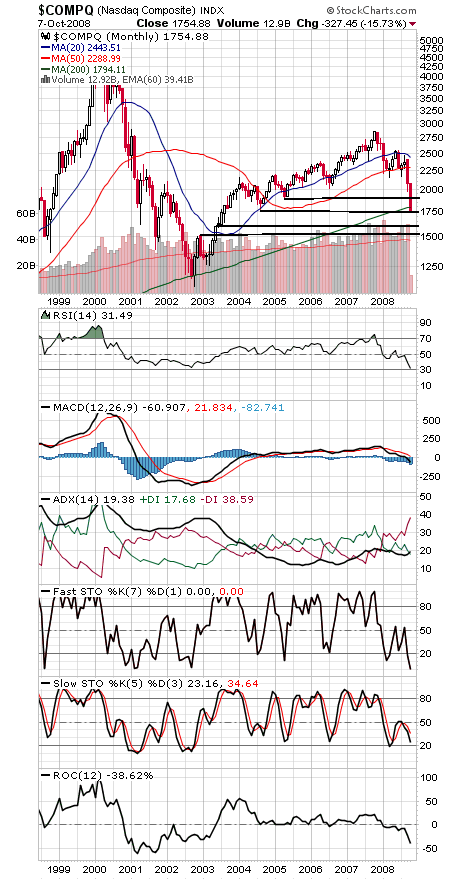
The Nasdaq (third chart) is sitting right on critical support at 1750; below that, 1521.44 is the next big level, although 1600 could provide some support. To the upside, 1794, 1889 and 2000 are resistance.
A very tough market indeed. It’s deeply oversold, and bearish sentiment is very high, but none of that has yet meant much to the market. If the gloom can lift just a little, the upside could be big.
Paul Shread is a Chartered Market Technician (CMT) and member of the Market Technicians Association.