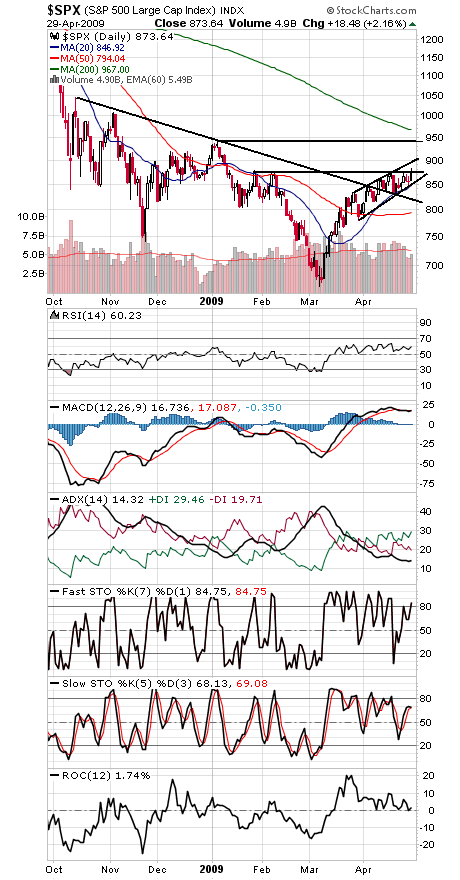
After testing 878 resistance for most of April, the S&P (first chart below) finally broke through today, only to fall back below by the close. The rally has been choppy and overlapping — never a good sign — but is so far holding up.
The next resistance level is 900, but 944 will be the critical test, a chance for the market to put in a higher major high for the first time since the 2007 market top. Support is 850-855 and 820.
One positive we’d note here is that the number of bulls in the weekly Investors Intelligence survey has fallen and the number of bears have risen as the market has chopped higher, a marked contrast from the November to January rally. The skepticism could serve to support the market. The survey showed 36-37 bulls-bears this week, down from 43-34 bulls-bears two weeks ago.
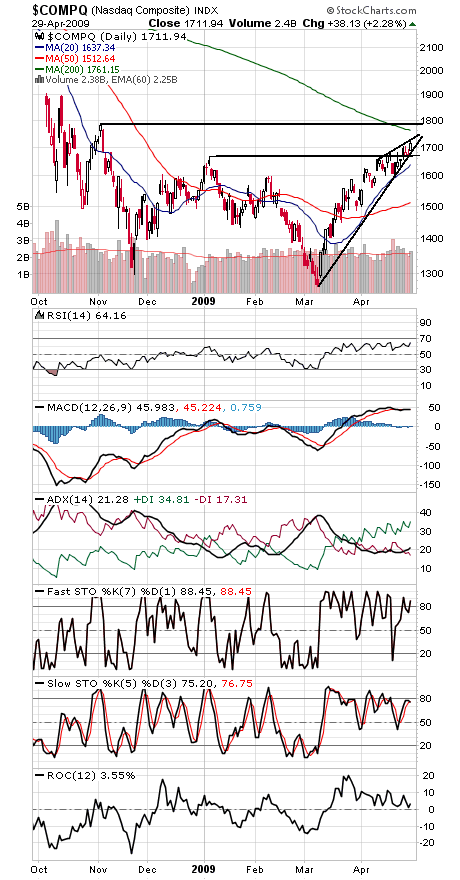
The Nasdaq (second chart) has been the market’s real strength, as the index stands just 3% from its 200-day moving average. A move above 1761-1785 could open the way for a move to 1900. Support is 1700, 1665 and 1640.
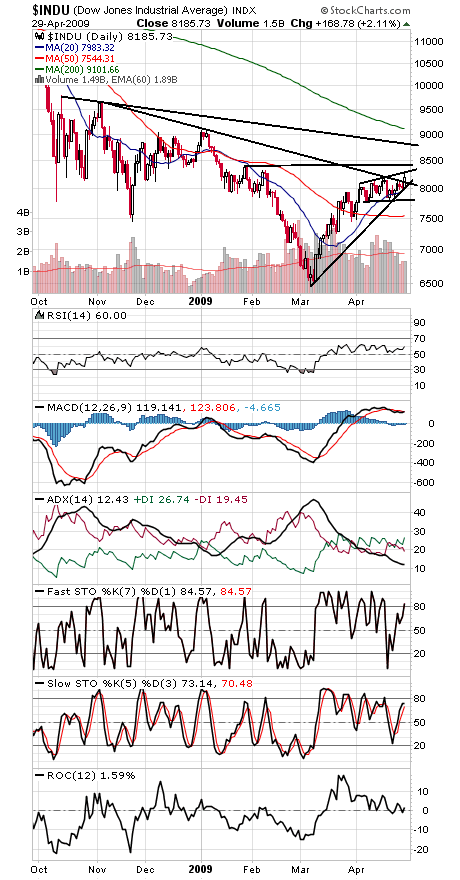
The Dow (third chart) faces resistance at 8300, 8405 and 8800, and 8100 is important first support, with 7800 strong support below that.
The market is nearing the end of its seasonally strongest six months, but so far the rally is hanging in there.
Paul Shread is a Chartered Market Technician (CMT) and member of the Market Technicians Association. He is a co-author of the book “Dow Theory Unplugged” from W&A Publishing.