Technical Analysis: Nasdaq Sees Its Shadow | Internet News

Technical Analysis: Nasdaq Sees Its Shadow

Written By
Paul Shread
Paul Shread
Feb 24, 2006
1 minute read


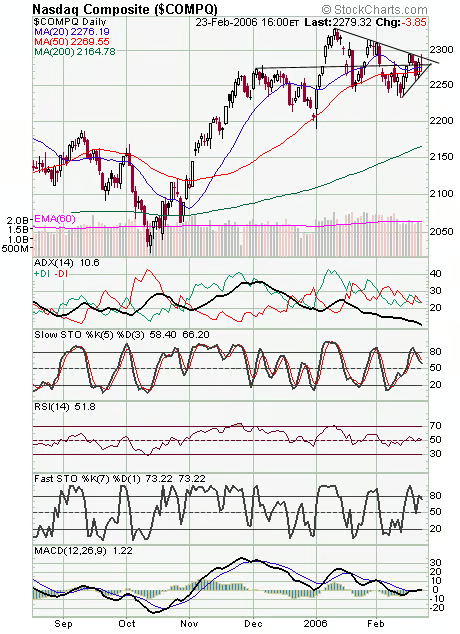
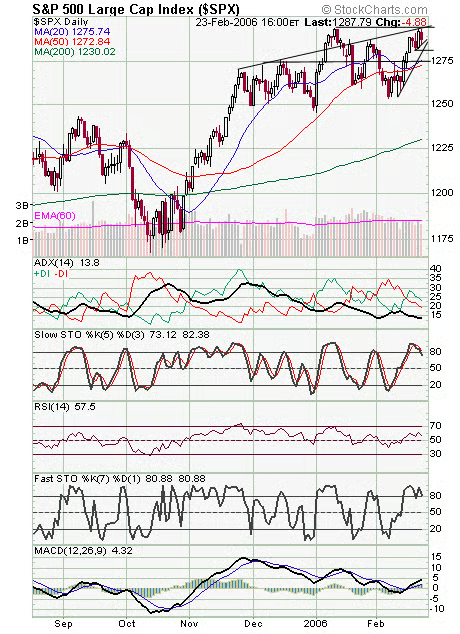
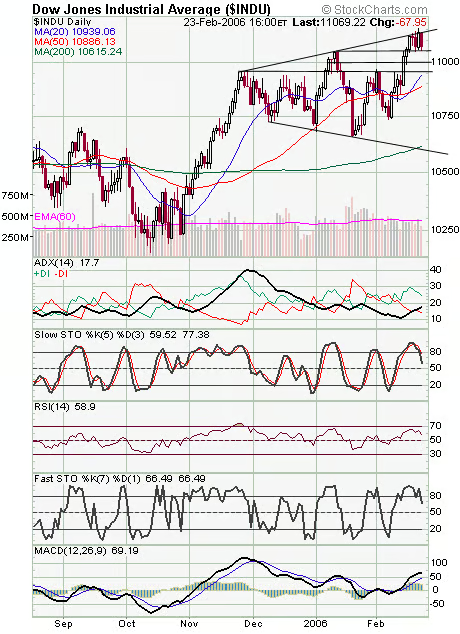
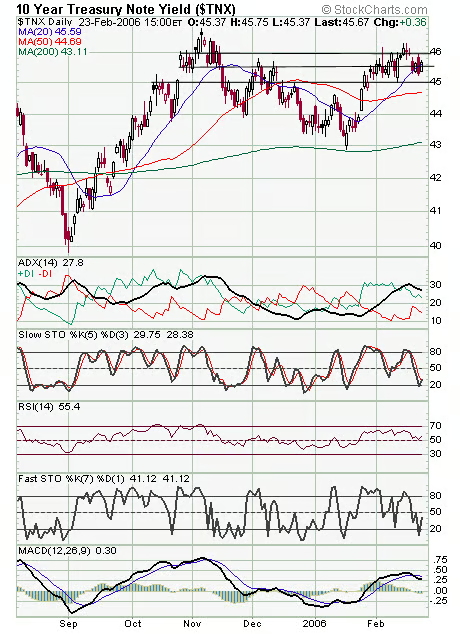
It may be three weeks after groundhog day, but the Nasdaq (first chart below) sure acted like it was today — the index saw its shadow and popped right back into its hole. Let’s see what happens in the next few days after that failed breakout. On one hand, the index’s ability to break through that was a positive, but the failure to hold the breakout on a closing basis could embolden sellers. 2270 is short-term support, and 2290-2295 is resistance. The S&P (second chart) remains stuck at major resistance at 1295. Support is 1282-1285 and 1273-1275. The Dow (third chart) stalled once again at the top of a three-month broadening pattern at 11,150, with 11,200 the next resistance above that. That is a potential topping pattern, so it’s one to keep an eye on. Support is 11,050, 11,000 and 10,960. Longs bonds (fourth chart) remain undecided here.


Internet News Logo

InternetNews is a source of industry news and intelligence for IT professionals from all branches of the technology world. InternetNews focuses on helping professionals grow their knowledge base and authority in their field with the top news and trends in Software, IT Management, Networking & Communications, and Small Business.

Property of TechnologyAdvice. © 2026 TechnologyAdvice. All Rights Reserved

Advertiser Disclosure: Some of the products that appear on this site are from companies from which TechnologyAdvice receives compensation. This compensation may impact how and where products appear on this site including, for example, the order in which they appear. TechnologyAdvice does not include all companies or all types of products available in the marketplace.