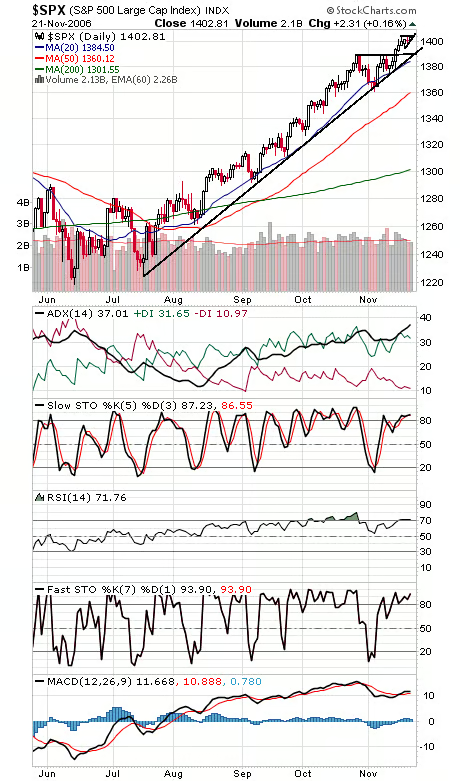
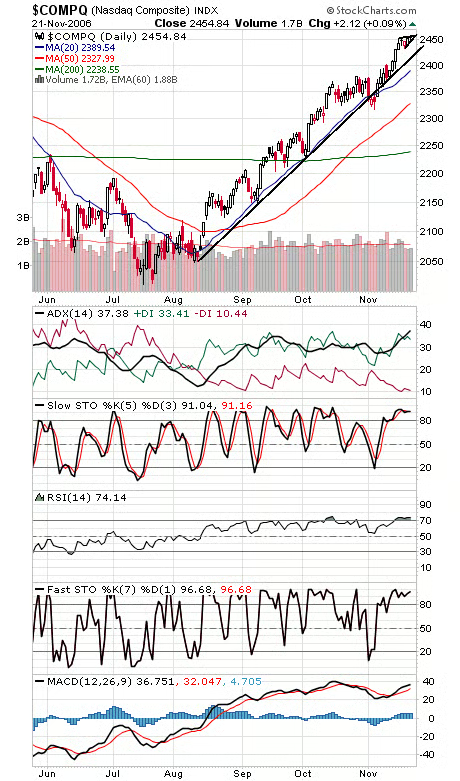
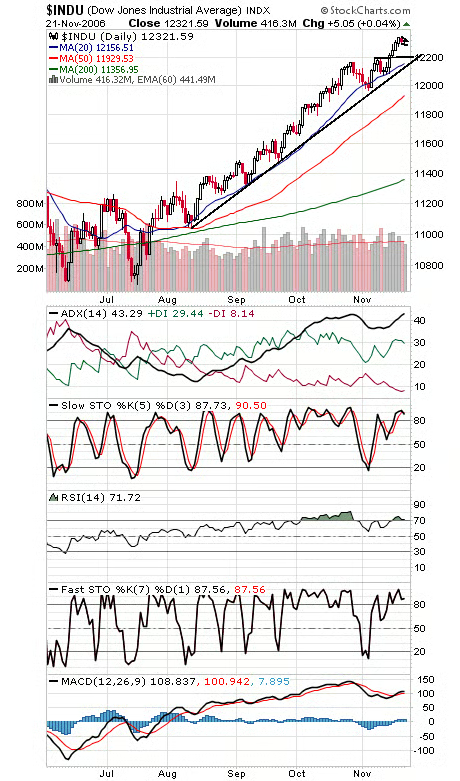
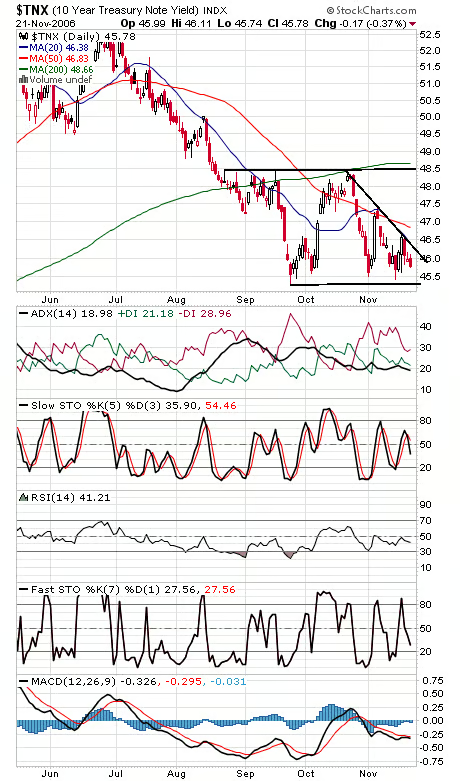
Looking at the action in the market since early November, we have a rally followed by a decline followed by another rally and now a sideways consolidation — that sounds very much like four waves of a five-wave Elliott wave up move, with the final wave up on deck. That suggests one more move up over the next few days followed by a decent correction. While some sentiment measures may be turning downright giddy, seasonal strength could help stocks from seeing too much of a correction for now, but keep an eye on the major uptrend lines on the indexes off the summer lows. The S&P (first chart below) has critical support at 1390, and resistance is 1404 and 1414-1426. The Nasdaq (second chart) has resistance at 2458-2459, and support is 2450, 2437, 2430 and 2420. The Dow (third chart) faces resistance at 12,330 and 12,355, and support is 12,280-12,300, 12,250, 12,200 and 12,150. Bond yields (fourth chart) continue to creep lower; are they ready for the big breakout?