Technical Analysis: Rally Hits Headwinds | Internet News

Technical Analysis: Rally Hits Headwinds

Written By
Paul Shread
Paul Shread
Jul 24, 2008
1 minute read

The rally ran out of steam today, not surprising given the number of indexes facing major overhead resistance here.

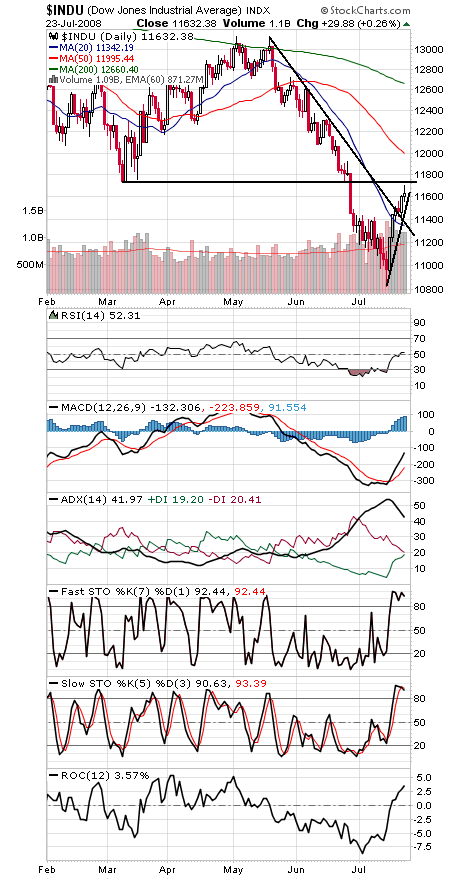
The Dow (first chart below) stopped just shy of 11,731-11,750, its March low and 2000 peak. If the index can clear that level, 12,000 looks possible. Support is 11,558, 11,500, 11,400 and 11,300.

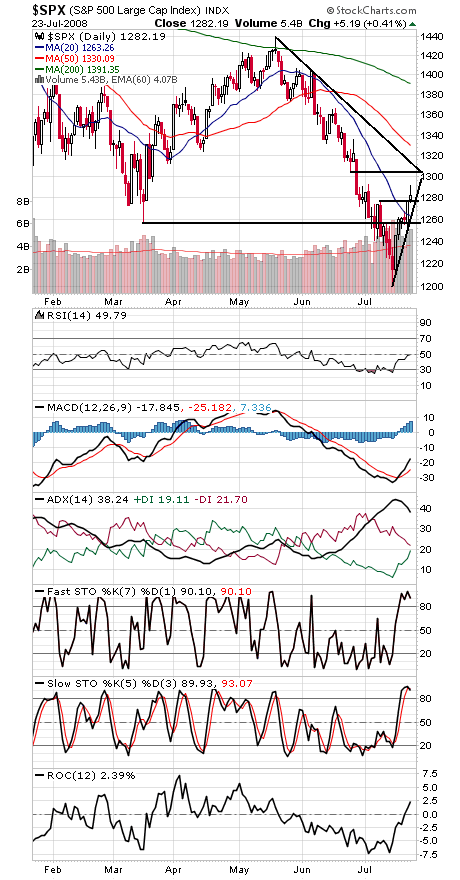
The S&P (second chart) stalled at 1292 resistance today, with 1304 and 1310 waiting above that. Support is 1276-1277, 1267, 1262, 1257, 1249, 1240 and 1234.

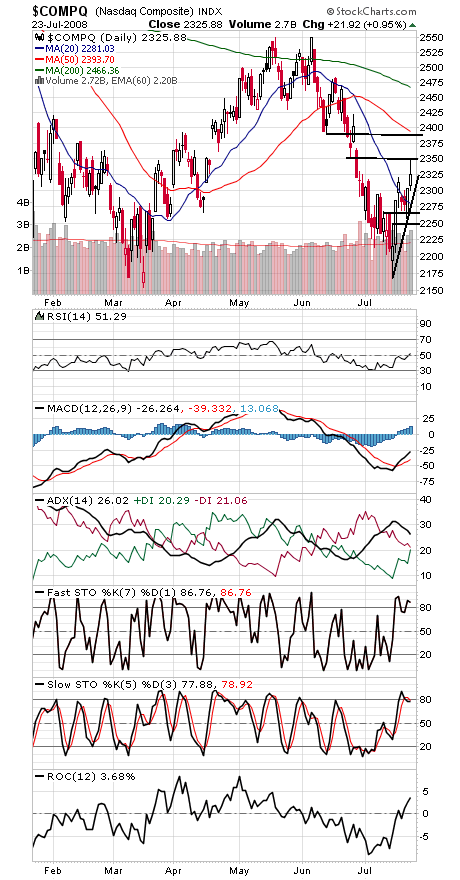
The Nasdaq (third chart) stalled at 2350 resistance today, but 2388 looks like a more important level, the bottom of the first leg down last month. 2300, 2270-2280 and 2250 are support.

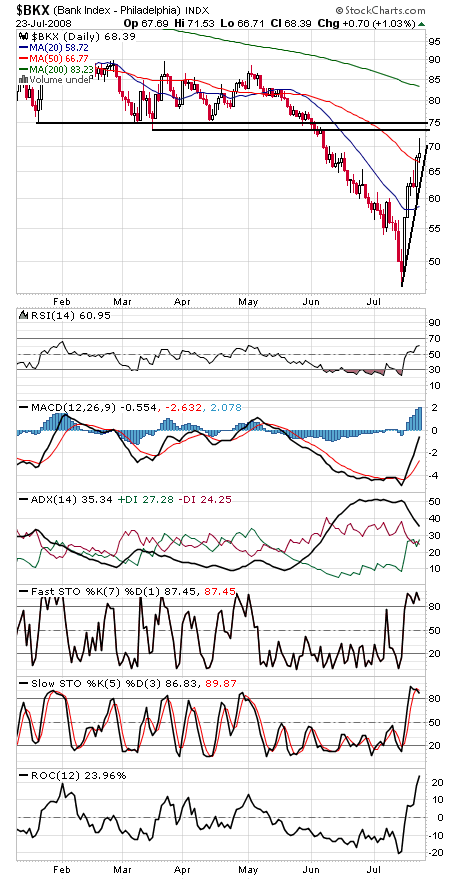
The bank index (fourth chart) is also nearing major resistance at 73.22-75. A nice recovery, but a good place for a pause.

Paul Shread is a Chartered Market Technician (CMT) and member of the Market Technicians Association.

Internet News Logo

InternetNews is a source of industry news and intelligence for IT professionals from all branches of the technology world. InternetNews focuses on helping professionals grow their knowledge base and authority in their field with the top news and trends in Software, IT Management, Networking & Communications, and Small Business.

Property of TechnologyAdvice. © 2026 TechnologyAdvice. All Rights Reserved

Advertiser Disclosure: Some of the products that appear on this site are from companies from which TechnologyAdvice receives compensation. This compensation may impact how and where products appear on this site including, for example, the order in which they appear. TechnologyAdvice does not include all companies or all types of products available in the marketplace.