Stocks have now had three sharp sell-offs in the last six trading days on fears that the European debt problem could spread. Volatility has certainly picked up, but are we at a market top? Let’s examine the evidence.
Sentiment certainly supports a correction. At 54-18 bulls to bears, the Investors Intelligence weekly sentiment survey hasn’t been this stretched since the market topped out in mid-January.
Seasonality is against the market here too. We’ve entered the weakest five months of the year for stocks in what is also historically the weakest year of the four-year presidential cycle, the mid-term election year, so that combination argues for caution between now and October.
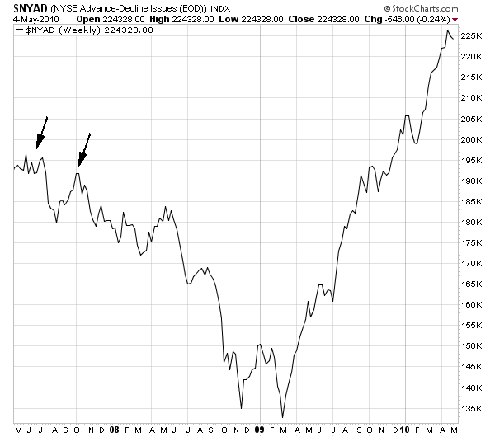
The one positive for the bulls here is the advance-decline line (first chart below), which has continued to make new highs along with the major indexes. We’ve seen no negative divergence — a declining A/D line and rising stock indexes — as we saw at the 2007 top. As bear markets tend to begin with eroding support in the broad market, the A/D line is the one indicator that remains in the bullish camp.
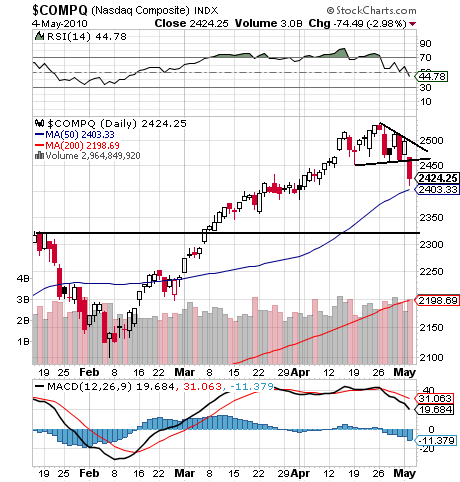
The Nasdaq (second chart below) stopped just above its 50-day average today. The next obvious support below 2400-2403 is 2300-2325, while a move above 2465 and 2500 would be a good start for the bulls. 2535-2551 has now become a major hurdle for this year-old bull market.
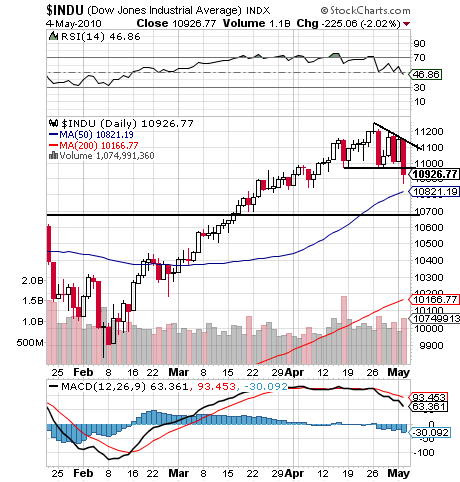
The Dow (third chart) has major support at 10,683-10,730, a level we’d like to see hold on a closing basis. 10,965-11,000 and 11,100 are resistance, with 11,258 and 11,400 above that.
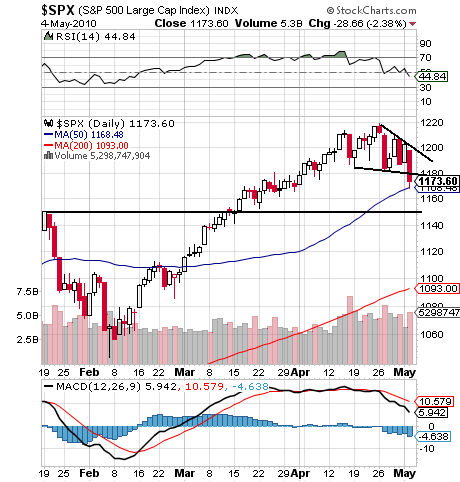
The S&P 500 (fourth chart) has important support at 1140-1150, with 1180 and 1200 the first resistance levels for the bulls. 1220 and 1257 are the next hurdles above that.
Paul Shread is a Chartered Market Technician (CMT) and member of the Market Technicians Association. He is a co-author of the book “Dow Theory Unplugged” from W&A Publishing.