Technical Analysis: Techs Break Down | Internet News

Technical Analysis: Techs Break Down

Written By
Paul Shread
Paul Shread
Feb 14, 2006
1 minute read


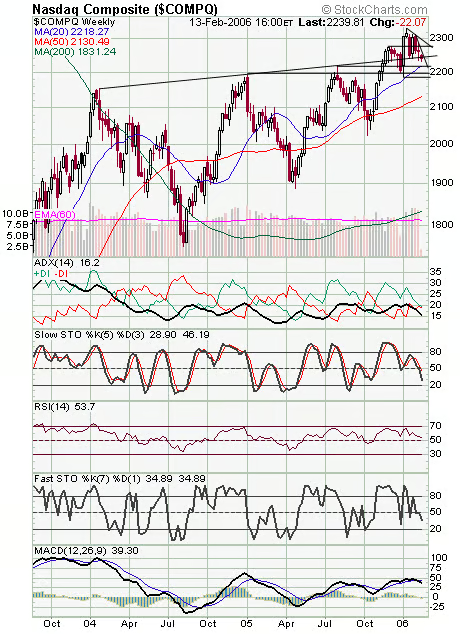
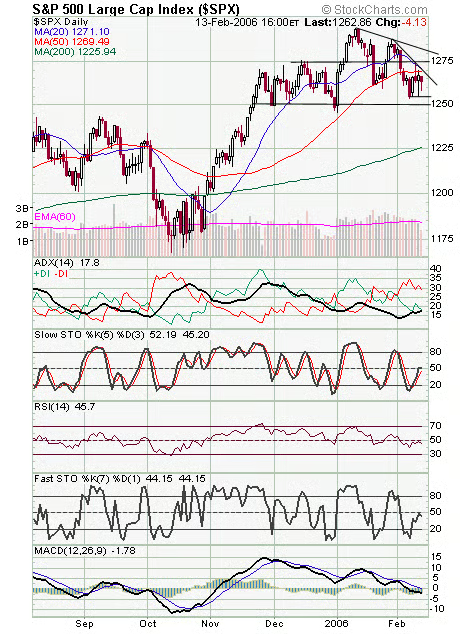
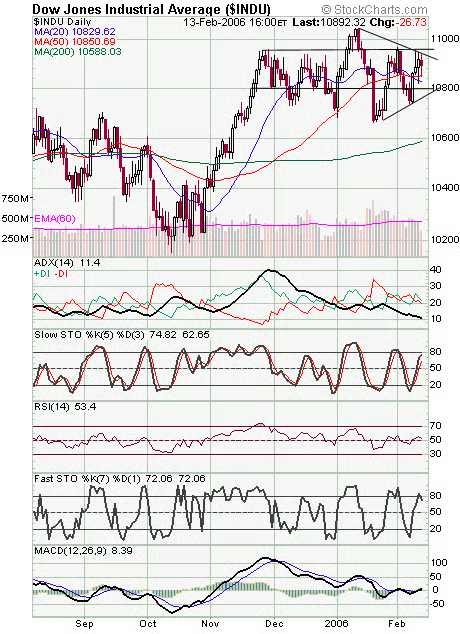
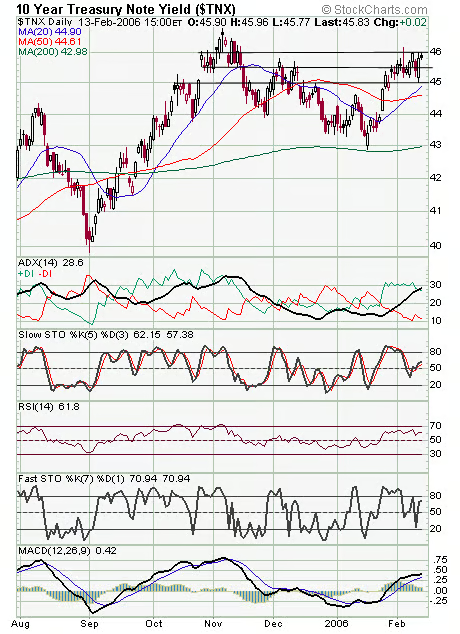
The Nasdaq (first chart below) fell back below its multi-year trendline today, a defeat for the bulls. Resistance is now 2245, with 2260 above that, and support levels are 2230-2232, 2220 and 2200. The S&P (second chart) has support at 1255 and 1246-1250, and resistance is at 1269 and 1275. The Dow (third chart) has support at 10,850, 10,800 and 10,740-10,770, and resistance is 10,940-10,960. Long bonds (fourth chart) continue to provide little support here.


Internet News Logo

InternetNews is a source of industry news and intelligence for IT professionals from all branches of the technology world. InternetNews focuses on helping professionals grow their knowledge base and authority in their field with the top news and trends in Software, IT Management, Networking & Communications, and Small Business.

Property of TechnologyAdvice. © 2026 TechnologyAdvice. All Rights Reserved

Advertiser Disclosure: Some of the products that appear on this site are from companies from which TechnologyAdvice receives compensation. This compensation may impact how and where products appear on this site including, for example, the order in which they appear. TechnologyAdvice does not include all companies or all types of products available in the marketplace.