Technical Analysis: Techs Break Out | Internet News

Technical Analysis: Techs Break Out

Written By
Paul Shread
Paul Shread
Nov 22, 2005
1 minute read

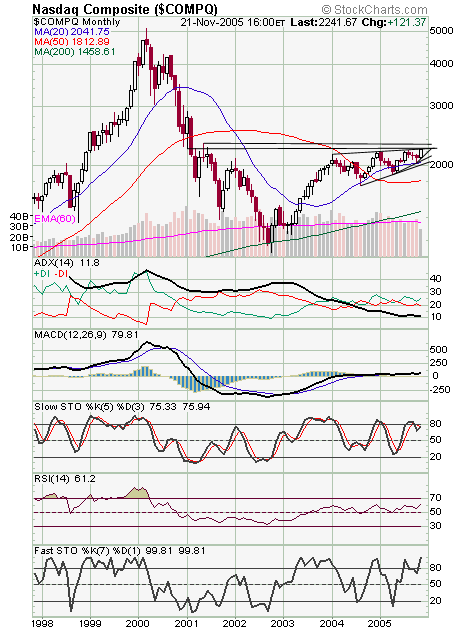
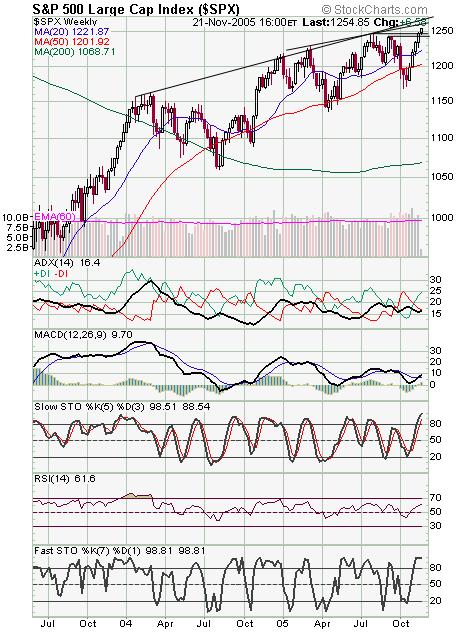
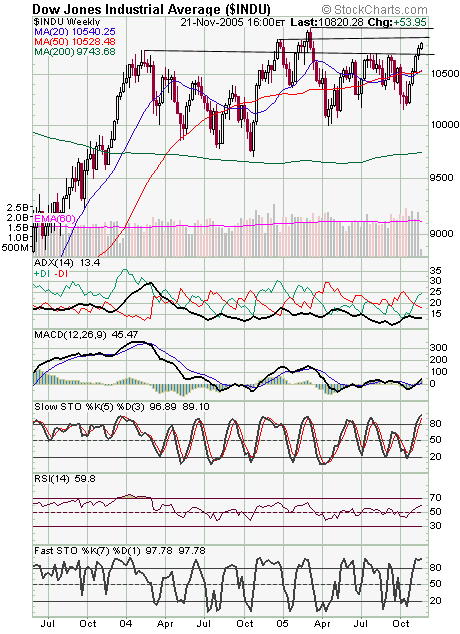
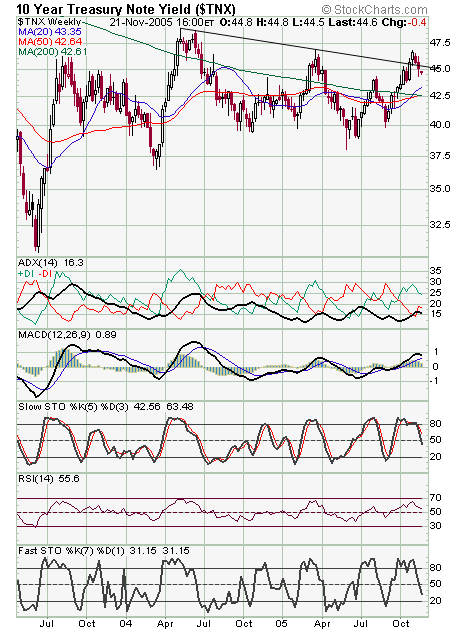
The Nasdaq (first chart below) cleared a resistance line today that has capped rallies for the last two years. No small breakout for the techs. The next big levels on the monthly chart are 2252 and 2328. Support is 2230-2235, 2220 and 2200-2207. The S&P (second chart) faces major resistance at 1260-1265, with 1275 above that. Support is 1250, 1246 and 1240-1242. The Dow (third chart) faces resistance at 10,868 and 10,985-11,000, and support is 10,720-10,753 and 10,650-10,670. Bonds (fourth chart) are hanging on here, but any rally had better include the short end of the yield curve or we’ll have inversion (short-term yields above long-term yields), a predictor of recession.


Internet News Logo

InternetNews is a source of industry news and intelligence for IT professionals from all branches of the technology world. InternetNews focuses on helping professionals grow their knowledge base and authority in their field with the top news and trends in Software, IT Management, Networking & Communications, and Small Business.

Property of TechnologyAdvice. © 2026 TechnologyAdvice. All Rights Reserved

Advertiser Disclosure: Some of the products that appear on this site are from companies from which TechnologyAdvice receives compensation. This compensation may impact how and where products appear on this site including, for example, the order in which they appear. TechnologyAdvice does not include all companies or all types of products available in the marketplace.