Technical Analysis: Techs Hold Up | Internet News

Technical Analysis: Techs Hold Up

Written By
Paul Shread
Paul Shread
Nov 9, 2005
1 minute read


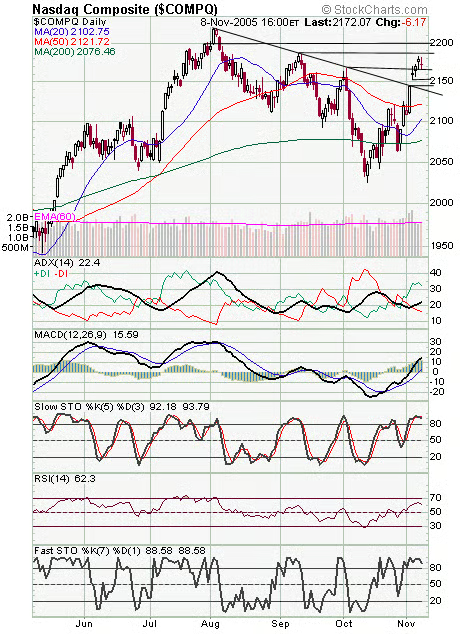
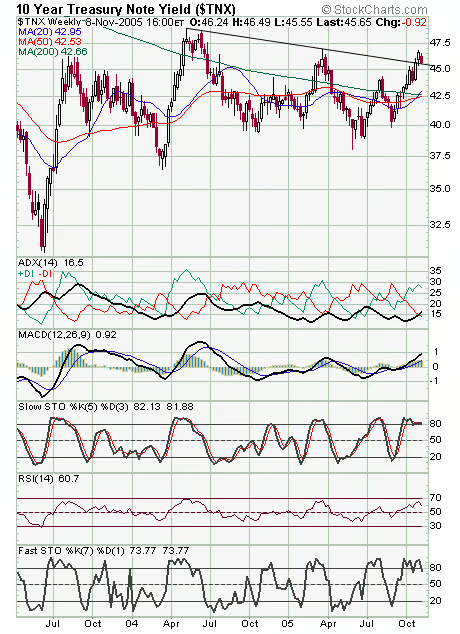
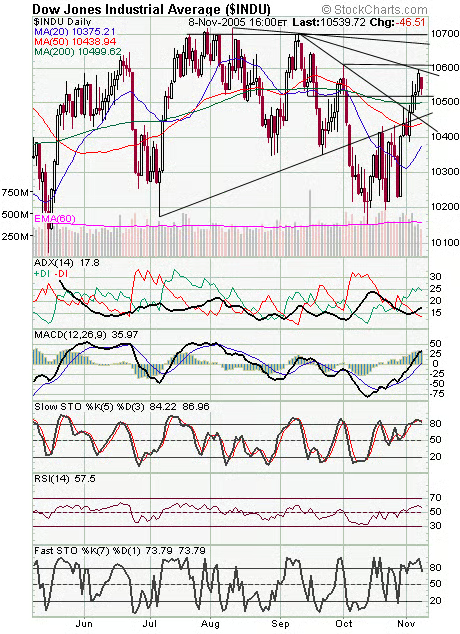
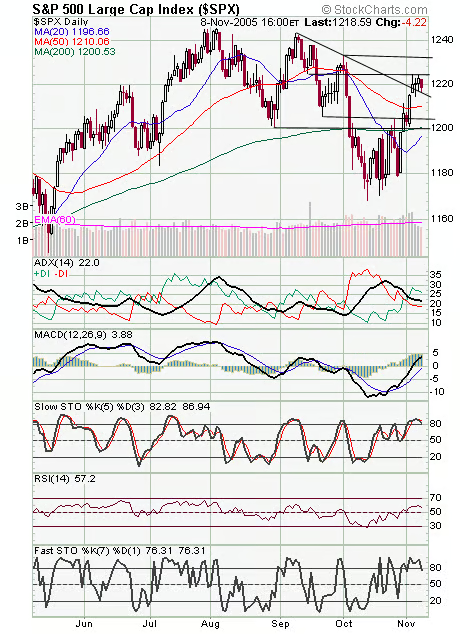
The Nasdaq (first chart below) is managing to hang on at high levels despite some overbought short-term readings. Resistance for the techs is 2187 and 2200, and support is 2166, 2160, 2153 and 2140-2145. Long bond yields (second chart) are heading in the right direction for a change. If they can get back below that 18-month downtrend line, bond bulls will have something to celebrate. We continue to look for bonds to take the lead here, and they’re finally showing some promise. Again, a bond rally while stocks pause or correct would be about the best set-up for the bulls here. The Dow (third chart) faces resistance at 10,590-10,620, 10,675 and 10,700, and support is 10,520, 10,500, 10,460 and 10,440. The S&P (fourth chart) is also holding up nicely here. Support is 1216, 1210 and 1200-1205, and resistance is 1226 and 1232.


Internet News Logo

InternetNews is a source of industry news and intelligence for IT professionals from all branches of the technology world. InternetNews focuses on helping professionals grow their knowledge base and authority in their field with the top news and trends in Software, IT Management, Networking & Communications, and Small Business.

Property of TechnologyAdvice. © 2026 TechnologyAdvice. All Rights Reserved

Advertiser Disclosure: Some of the products that appear on this site are from companies from which TechnologyAdvice receives compensation. This compensation may impact how and where products appear on this site including, for example, the order in which they appear. TechnologyAdvice does not include all companies or all types of products available in the marketplace.