SHARE
Facebook X Pinterest WhatsApp

Technical Analysis: Now That’s More Like It

Written By
thumbnail
Paul Shread
Paul Shread
Jun 16, 2006

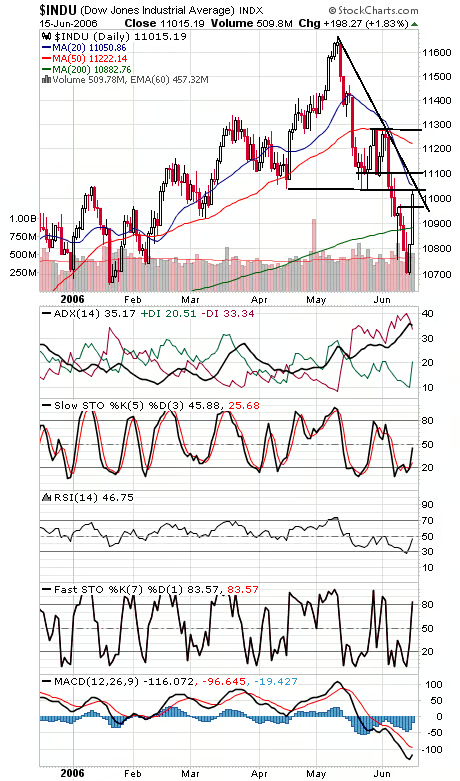
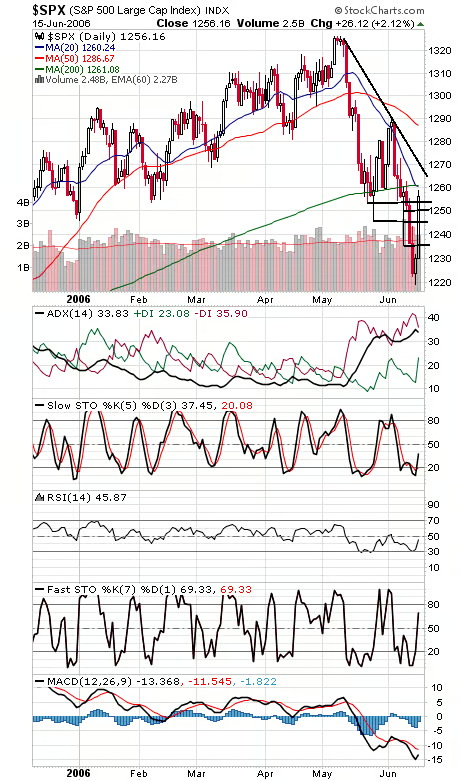
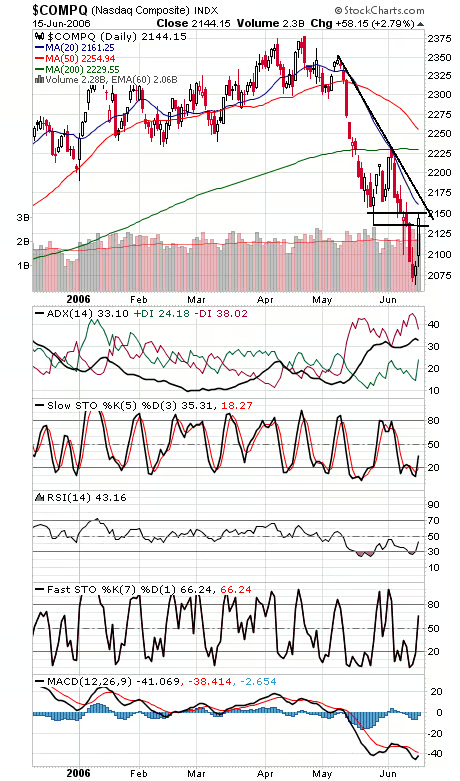
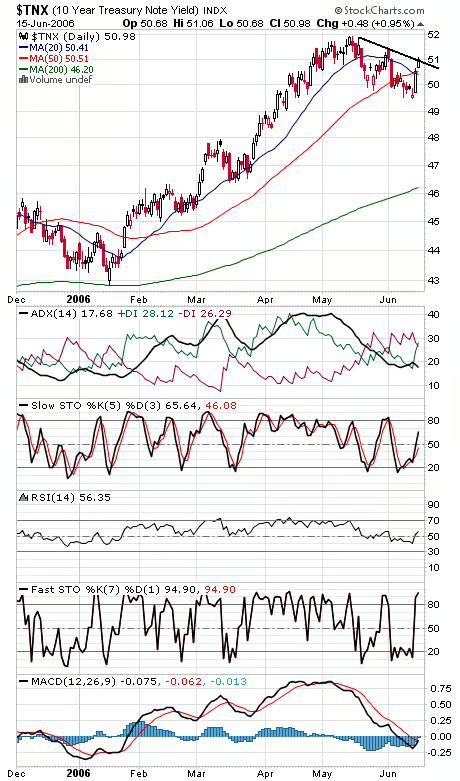
So much for yesterday’s unimpressive internals. The question now becomes whether today’s 90% upside days on the NYSE and Nasdaq were bullish or bearish — either sellers showing remorse and jumping back in, or too much buying that exhausts demand. Whatever the answer, we sure don’t think today was neutral. The Dow (first chart below) faces a lot of resistance at 11,040-11,050 — a big test there. Support is now 10,950 and 10,885. The S&P (second chart) faces resistance at 1261 and 1268, and support is 1250, 1245 and 1230-1235. The Nasdaq (third chart) faces tough resistance at 2167-2170, and support is 2135, 2125 and 2100. Long bond yields (fourth chart) continue to head higher.


Recommended for you...

U.S. Needs to Protect Tech Leadership: Qualcomm
Rob Enderle
Apr 8, 2022
HP’s ExtendXR Service Gets an Early Lead on a Looming Metaverse Problem
Rob Enderle
Mar 5, 2022
Cisco’s Purpose Is to Improve the World. Imagine if Others Followed.
Rob Enderle
Dec 17, 2021
HP Builds an Advanced Cloud Workstation for the Metaverse
Rob Enderle
Nov 13, 2021
Internet News Logo

InternetNews is a source of industry news and intelligence for IT professionals from all branches of the technology world. InternetNews focuses on helping professionals grow their knowledge base and authority in their field with the top news and trends in Software, IT Management, Networking & Communications, and Small Business.

Property of TechnologyAdvice. © 2025 TechnologyAdvice. All Rights Reserved

Advertiser Disclosure: Some of the products that appear on this site are from companies from which TechnologyAdvice receives compensation. This compensation may impact how and where products appear on this site including, for example, the order in which they appear. TechnologyAdvice does not include all companies or all types of products available in the marketplace.