Technical Analysis: A New Low for the Nasdaq | Internet News

Technical Analysis: A New Low for the Nasdaq

Written By
Paul Shread
Paul Shread
Jul 14, 2006
1 minute read

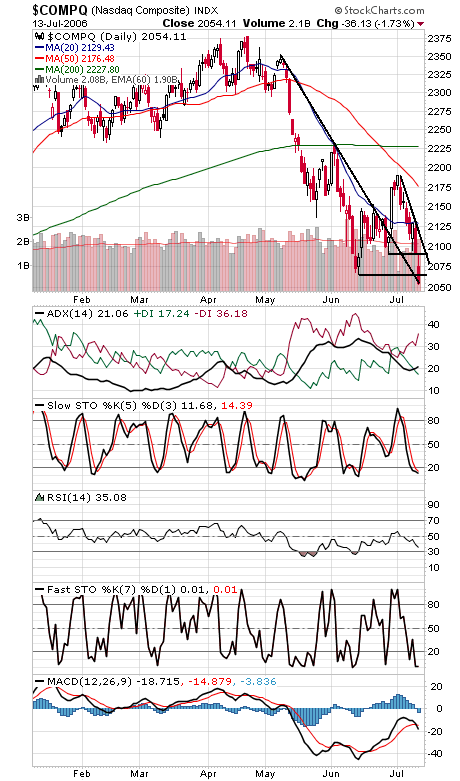
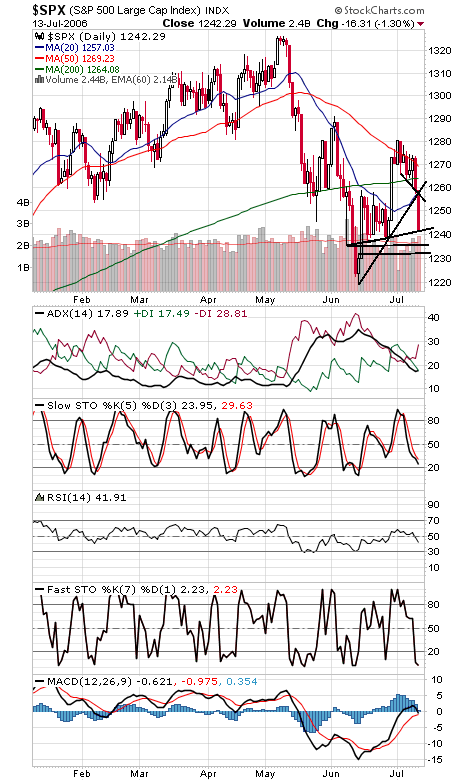
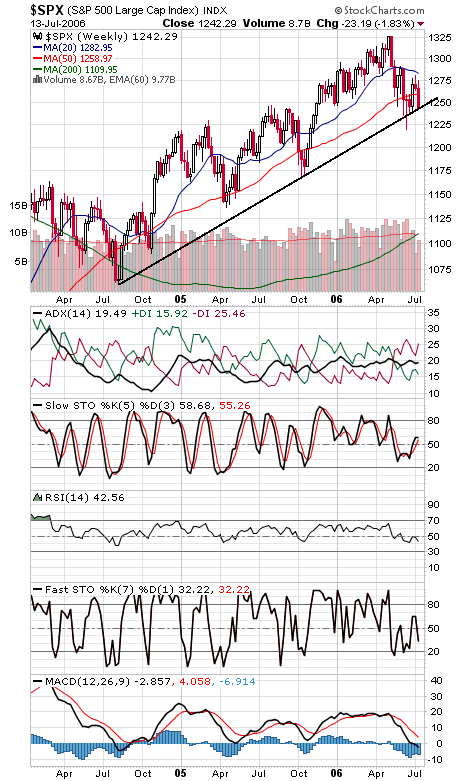
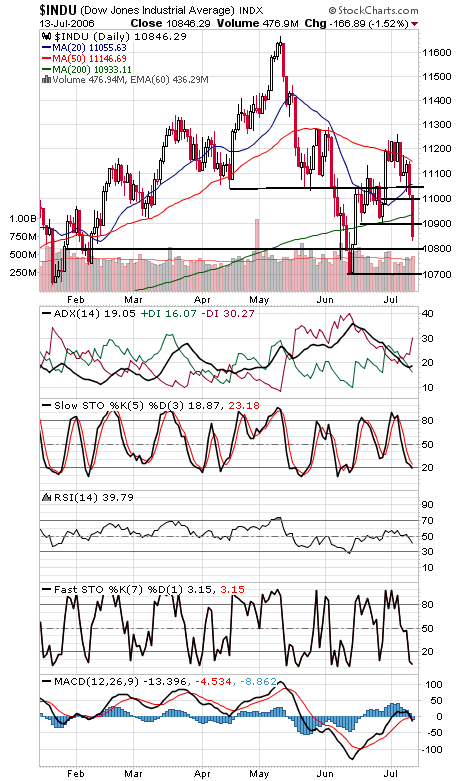
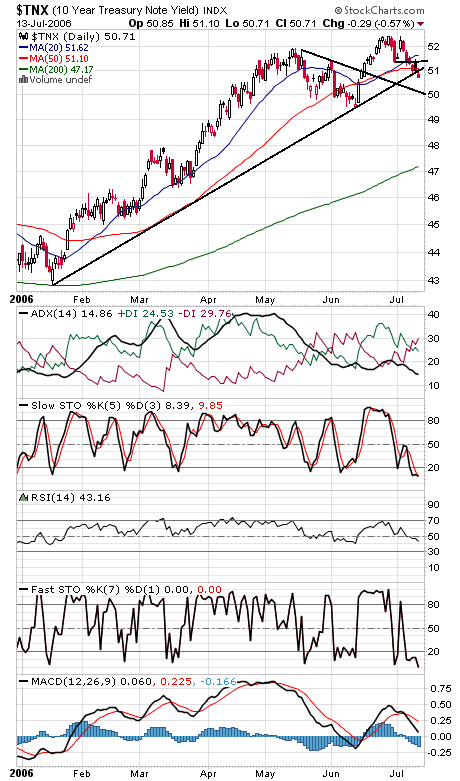
The Nasdaq (first chart below) continued its underperformance today with a new low for the year; will the rest of the indexes follow? On the plus side, the Nasdaq should have strong support at 2000-2025, but we remain in the weakest months of the four-year cycle until October. To the upside, the first resistance levels are 2065 and 2090-2100. The S&P (second and third charts) ended the day right on its August 2004 trendline. If that goes, the next support levels are 1235-1237 and 1232, and resistance is 1245-1250, 1256, 1260 and 1264. The Dow (fourth chart) gave up a couple of support levels today. The next levels to watch are 10,800 and 10,700, and resistance is 10,900, 10,936 and 11,000-11,040. Long bond yields (fifth chart) continue to benefit from flight to quality.


Internet News Logo

InternetNews is a source of industry news and intelligence for IT professionals from all branches of the technology world. InternetNews focuses on helping professionals grow their knowledge base and authority in their field with the top news and trends in Software, IT Management, Networking & Communications, and Small Business.

Property of TechnologyAdvice. © 2026 TechnologyAdvice. All Rights Reserved

Advertiser Disclosure: Some of the products that appear on this site are from companies from which TechnologyAdvice receives compensation. This compensation may impact how and where products appear on this site including, for example, the order in which they appear. TechnologyAdvice does not include all companies or all types of products available in the marketplace.