Technical Analysis: A Star Appears on the Nasdaq | Internet News

Technical Analysis: A Star Appears on the Nasdaq

Written By
Paul Shread
Paul Shread
Nov 4, 2005
1 minute read


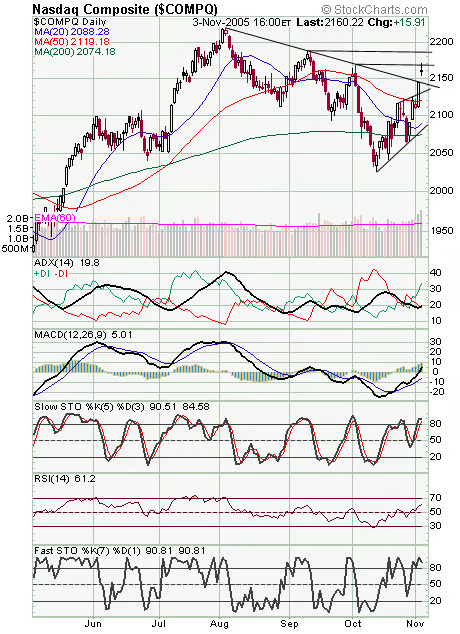
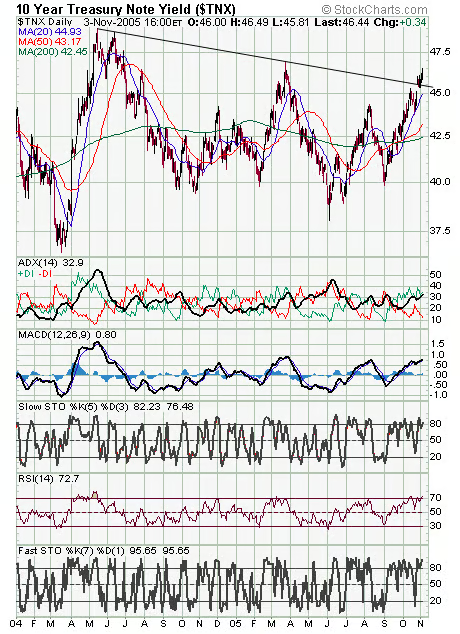
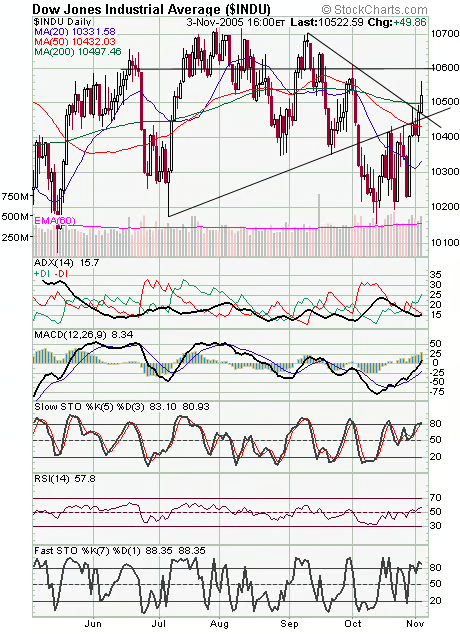
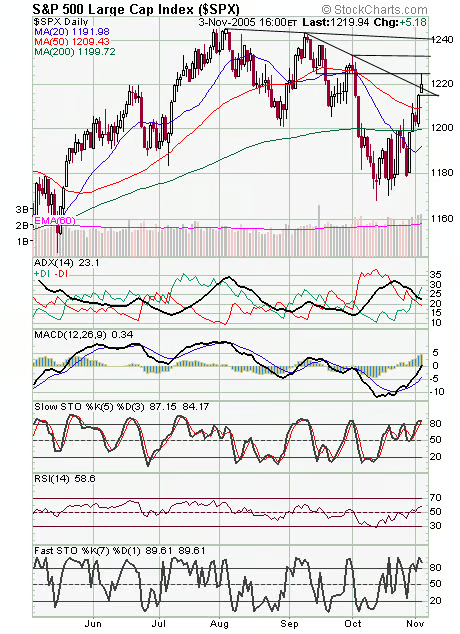
One heck of a nice breakout on the Nasdaq (first chart below) today — but the index looks a little wobbly ahead of tomorrow’s big jobs report. The index barely closed higher than its open, forming a beauty of a “doji star” here, suggesting indecision, and internals on both exchanges deteriorated today. The index faces resistance at 2070 and 2087, and support is 2153, 2140-2142 and 2130. Again, stocks face significant headwinds without the support of the bond market (second chart), with yields still in a strong uptrend. The Dow (third chart) faces resistance at 10,561 and 10,600, and support is 10,500 and 10,460-10,470. The S&P (fourth chart) cleared a big hurdle. The next levels to the upside are 1226 and 1232, and support is 1215-1217 and 1210.


Internet News Logo

InternetNews is a source of industry news and intelligence for IT professionals from all branches of the technology world. InternetNews focuses on helping professionals grow their knowledge base and authority in their field with the top news and trends in Software, IT Management, Networking & Communications, and Small Business.

Property of TechnologyAdvice. © 2026 TechnologyAdvice. All Rights Reserved

Advertiser Disclosure: Some of the products that appear on this site are from companies from which TechnologyAdvice receives compensation. This compensation may impact how and where products appear on this site including, for example, the order in which they appear. TechnologyAdvice does not include all companies or all types of products available in the marketplace.