A tough trading week — the market went nowhere on four of five days this week, and did it in volatile fashion. On the plus side, we have a few more days of monthly inflows to support the market, but the S&P’s all-time high of 1527.46 and 1552.87 remains a difficult spot. The market has so far been able to avoid a wholesale sell-off here, but which way the current trading range resolves will likely determine the next big move for stocks.
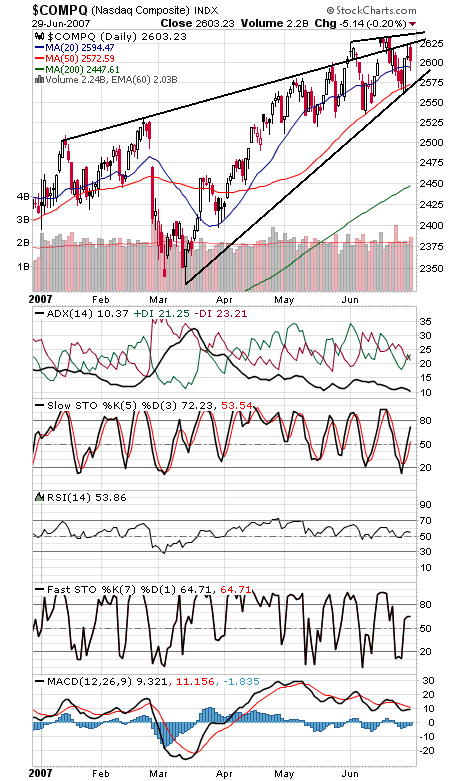
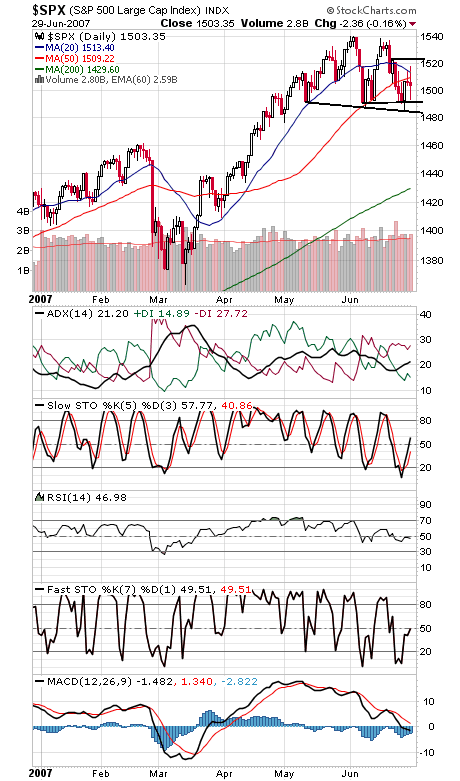
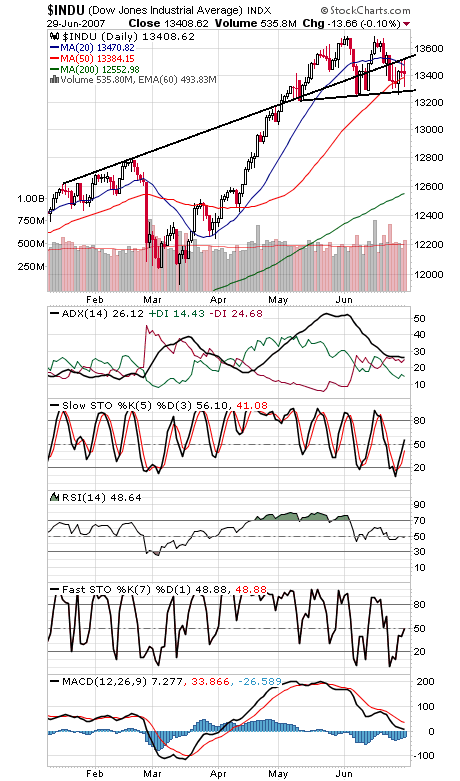
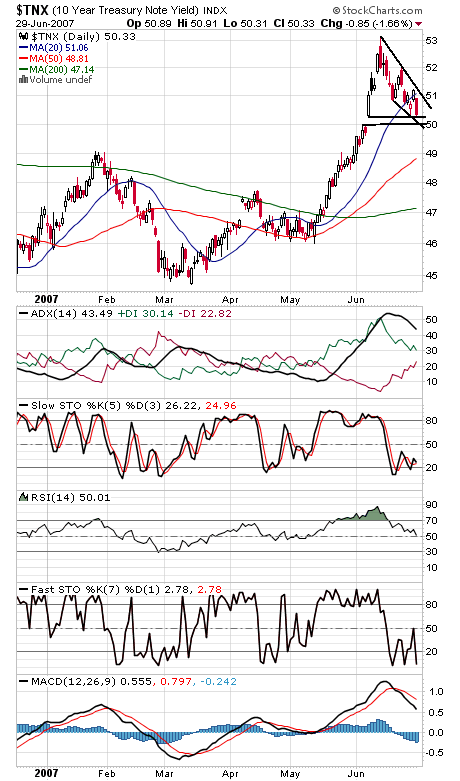
The Nasdaq (first chart below) faces tough resistance at 2626 and 2637, and support is 2585-2590 and 2575. The S&P (second chart) faces resistance at 1510-1512 and 1518-1524, and support is 1492-1493 and 1485. The Dow (third chart) has important support at 13,250-13,310, and 13,460, 13,500 and 13,530 are resistance. A nice rally in bonds today (fourth chart), but the 10-year yield is in a tight range between 5.0% and 5.1%.
Paul Shread is a Chartered Market Technician (CMT) and member of the Market Technicians Association