Technical Analysis: Another Attempt at Resistance | Internet News

Technical Analysis: Another Attempt at Resistance

Written By
Paul Shread
Paul Shread
Dec 23, 2005
1 minute read


Note: The Technical Analysis column will return Jan. 3. Happy holidays and best wishes for a prosperous 2006!

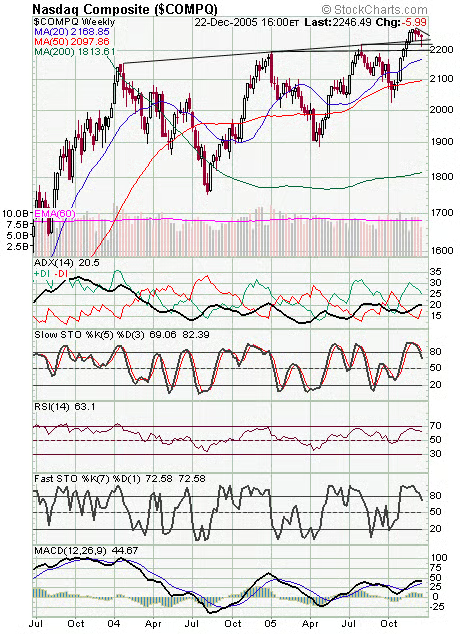
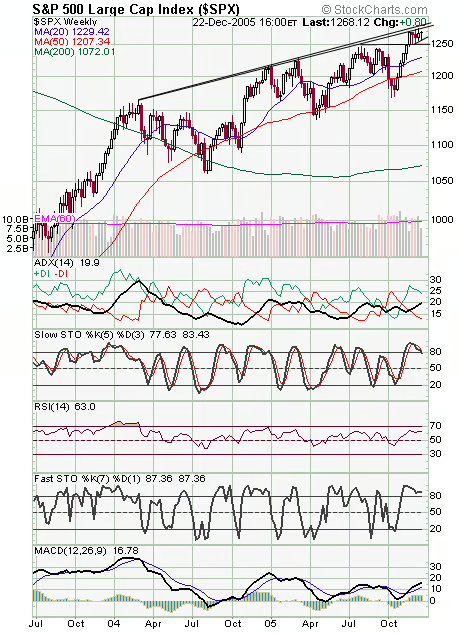
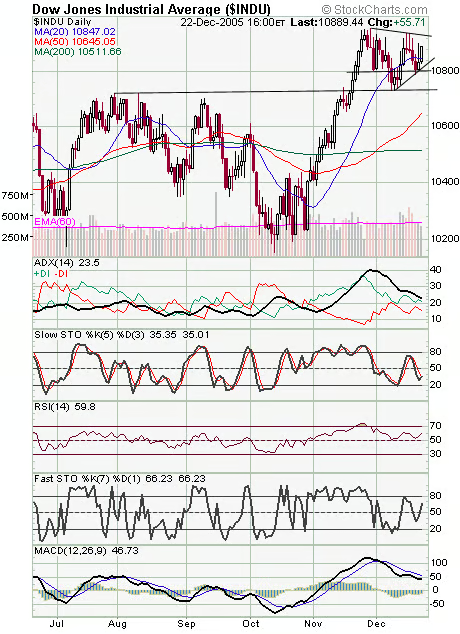
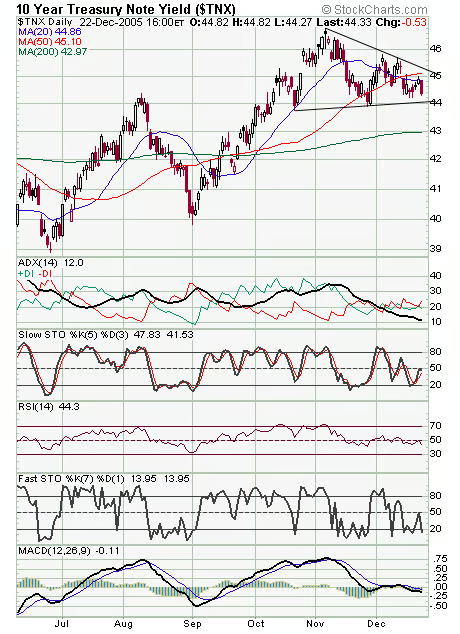
A nice move for the Nasdaq (first chart below) today, which is now back above that critical trendline that sits at 2235. That level is first support, with 2220, 2213, 2206 and 2200 below that. Resistance is 2260 and 2278. The S&P (second chart) stall faces major resistance at roughly 1277-1285 — a very big level for the market there. Support is 1257-1260 and 1246-1250. The Dow (third chart) needs to take out that stubborn 10,950-11,000 resistance zone, and support is 10,800-10,830 and 10,720-10,750. Long bonds (fourth chart) are behaving nicely here — knock on wood!


Internet News Logo

InternetNews is a source of industry news and intelligence for IT professionals from all branches of the technology world. InternetNews focuses on helping professionals grow their knowledge base and authority in their field with the top news and trends in Software, IT Management, Networking & Communications, and Small Business.

Property of TechnologyAdvice. © 2026 TechnologyAdvice. All Rights Reserved

Advertiser Disclosure: Some of the products that appear on this site are from companies from which TechnologyAdvice receives compensation. This compensation may impact how and where products appear on this site including, for example, the order in which they appear. TechnologyAdvice does not include all companies or all types of products available in the marketplace.