Technical Analysis: Another Day, Another Rally | Internet News

Technical Analysis: Another Day, Another Rally

Written By
Paul Shread
Paul Shread
Nov 15, 2006
1 minute read

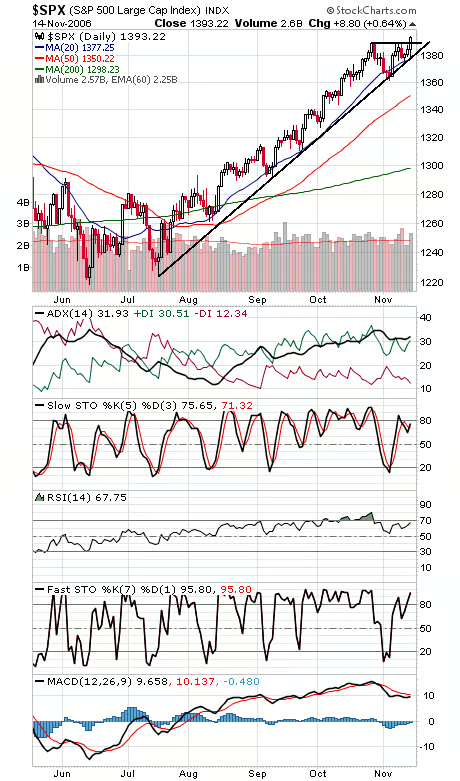
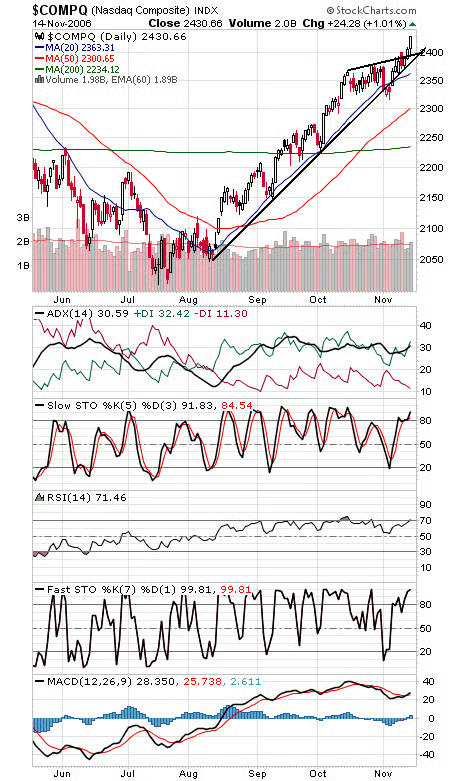
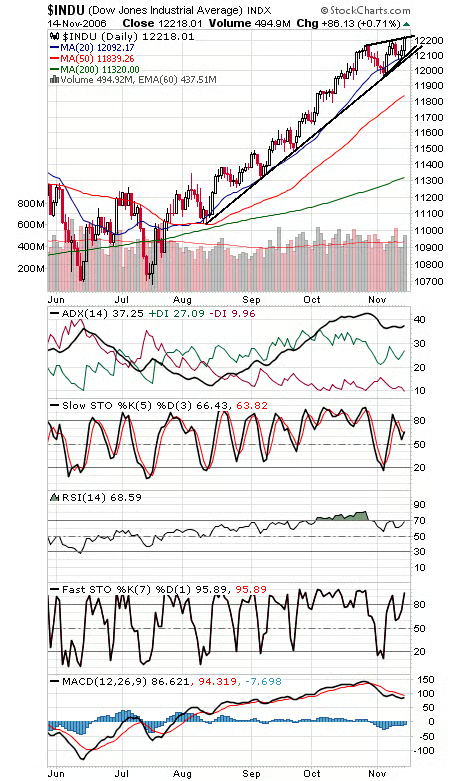
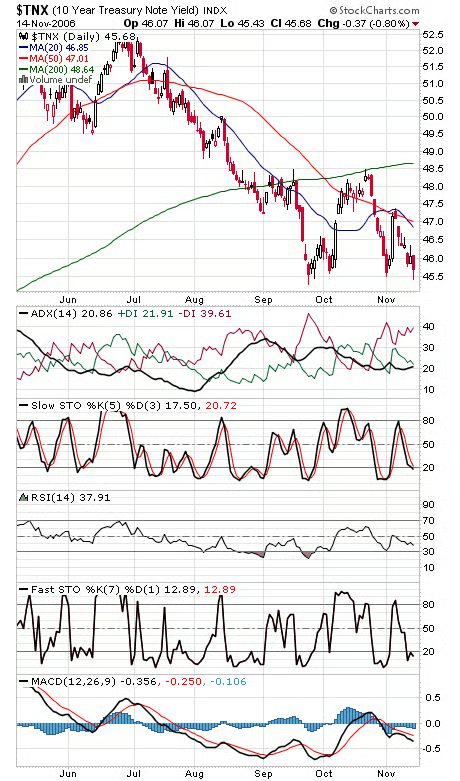
Another day, another breakout, and until traders show signs of excess enthusiasm, that trend will likely continue. The S&P (first chart below) has the best-defined resistance levels at this point, so we’ll start with that index. First up is 1395, the equivalent of 1400 on the futures, where the index stalled today. Above that, the 1400 and 1414-1426 levels come into play. To the downside, first support is 1389, and 1380 is critical. The Nasdaq (second chart) took out 2420-2425 resistance, which is now first support, with 2400 below that. Next up is 2450. The Dow (third chart) is hitting a bit of rising resistance here, while the general support area is 12,080-12,130, with 12,200 first support. Bond yields (fourth chart) came close to a breakout today before stalling.


Internet News Logo

InternetNews is a source of industry news and intelligence for IT professionals from all branches of the technology world. InternetNews focuses on helping professionals grow their knowledge base and authority in their field with the top news and trends in Software, IT Management, Networking & Communications, and Small Business.

Property of TechnologyAdvice. © 2026 TechnologyAdvice. All Rights Reserved

Advertiser Disclosure: Some of the products that appear on this site are from companies from which TechnologyAdvice receives compensation. This compensation may impact how and where products appear on this site including, for example, the order in which they appear. TechnologyAdvice does not include all companies or all types of products available in the marketplace.