Technical Analysis: Another Support Level Goes | Internet News

Technical Analysis: Another Support Level Goes

Written By
Paul Shread
Paul Shread
Nov 20, 2007
1 minute read

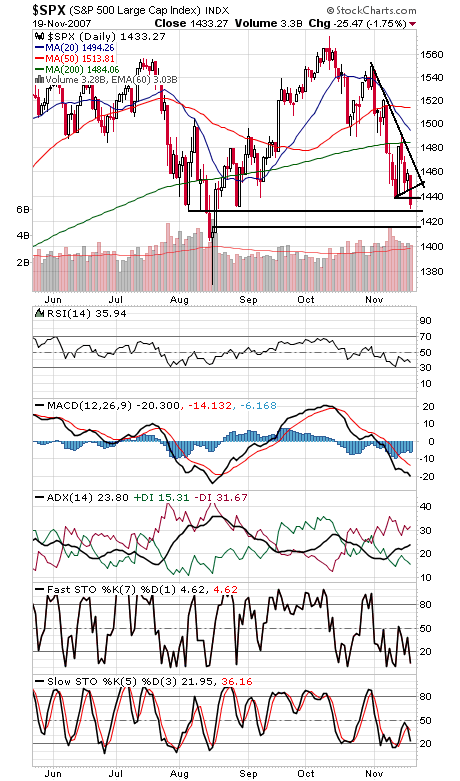
So much for November and December being the strongest months of the year for stocks, as the major indexes have plunged through one support level after another this month.

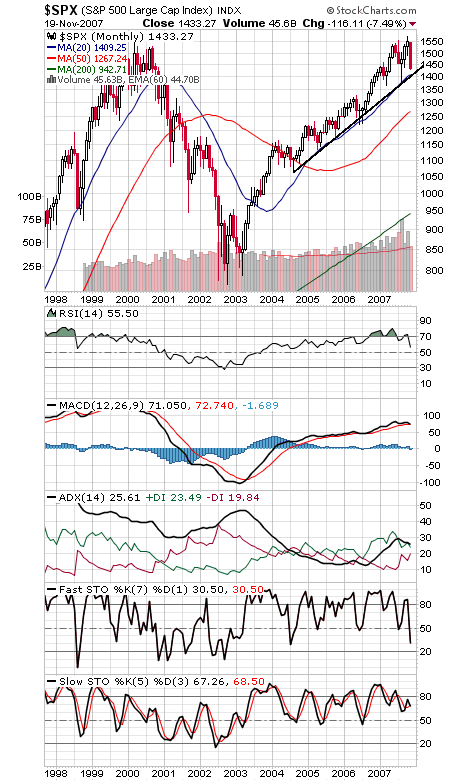
The S&P 500 (first two charts below) is now sitting on 1427-1432 support. Below that, 1416 and 1410 are the last hopes for avoiding a complete test of the August lows. To the upside, reclaiming 1438-1441, 1448-1450 and 1464 would be a good start.

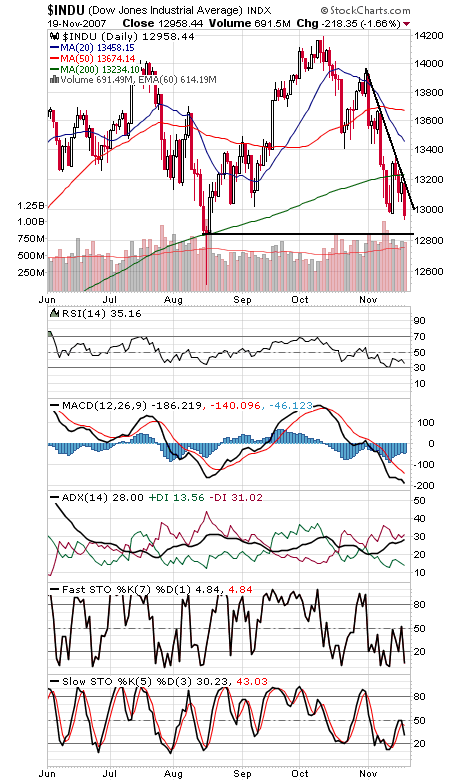
The Nasdaq (third chart) is barely clinging to 2583 support, while the Dow (fourth chart) has critical support at 12,845. Resistance is 2615 on the Nasdaq and 13,120 on the Dow, a couple of sharp downtrend lines.

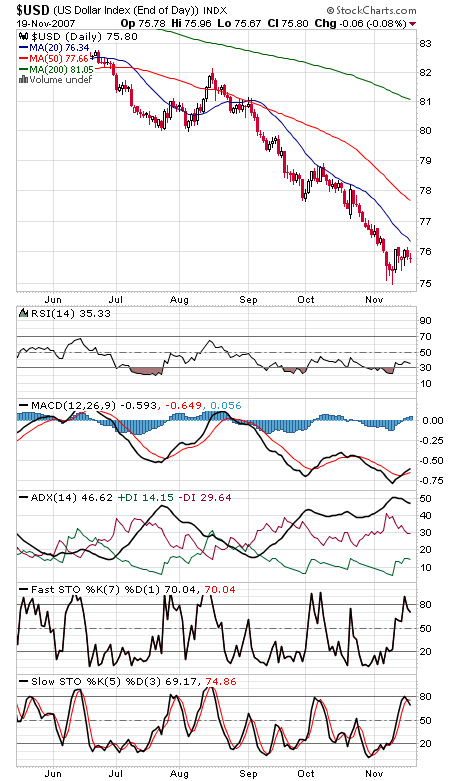
And finally, it’s interesting to note that the greenback (fifth chart) hasn’t made a new low in more than a week despite the global panic over the falling dollar.

Paul Shread is a Chartered Market Technician (CMT) and member of the Market Technicians Association.


Internet News Logo

InternetNews is a source of industry news and intelligence for IT professionals from all branches of the technology world. InternetNews focuses on helping professionals grow their knowledge base and authority in their field with the top news and trends in Software, IT Management, Networking & Communications, and Small Business.

Property of TechnologyAdvice. © 2026 TechnologyAdvice. All Rights Reserved

Advertiser Disclosure: Some of the products that appear on this site are from companies from which TechnologyAdvice receives compensation. This compensation may impact how and where products appear on this site including, for example, the order in which they appear. TechnologyAdvice does not include all companies or all types of products available in the marketplace.