Technical Analysis: Back to Support | Internet News

Technical Analysis: Back to Support

Written By
Paul Shread
Paul Shread
Apr 12, 2007
1 minute read

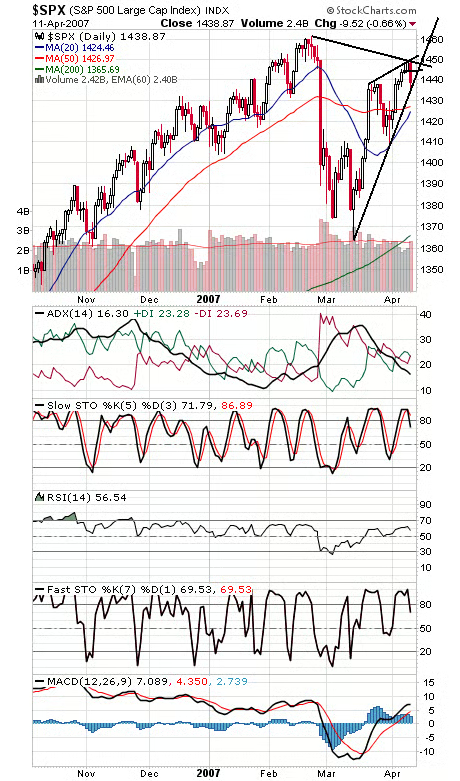
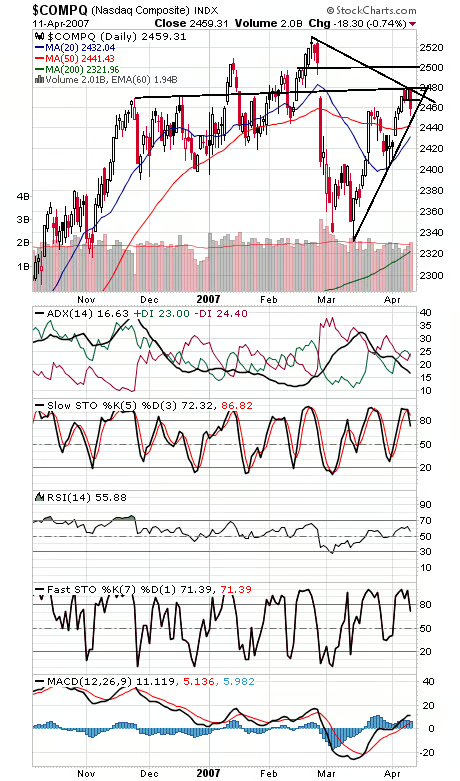
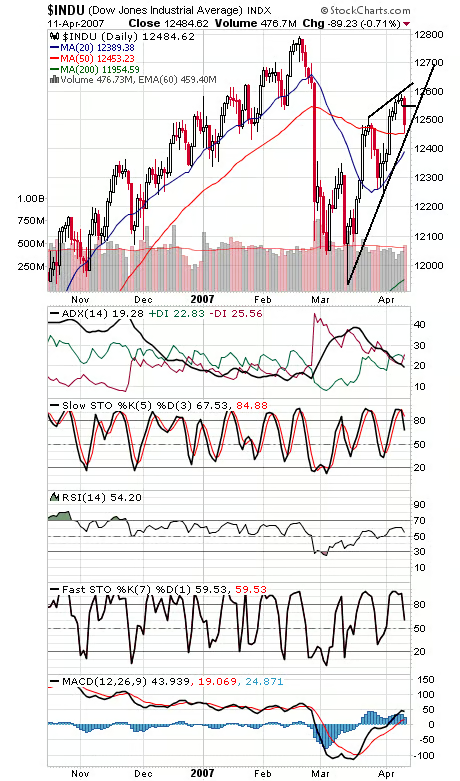
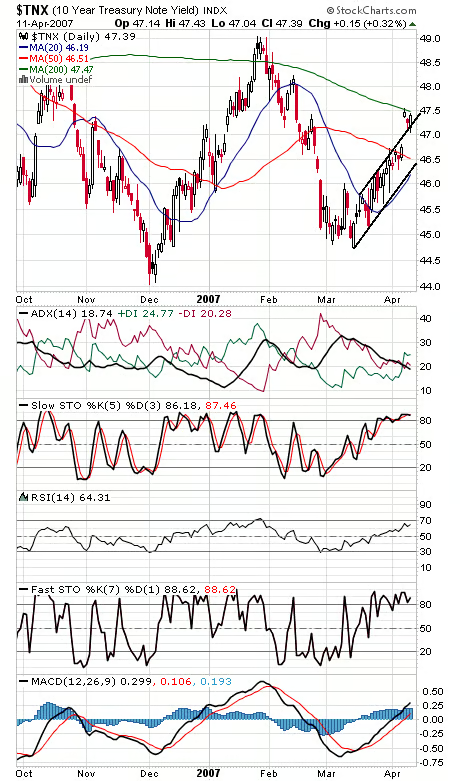
We may finally be getting the mid-month pullback we were looking for; now we’ll see if the indexes can make this correction a shallow one. The S&P (first chart below) stopped right at its March uptrend line today; any move lower from here would break that line, with 1427-1430 the next possible support zone. To the upside, 1448-1452 is tough resistance. The Nasdaq (second chart) has its March uptrend line just above 2450 for tomorrow, with 2441 the next support level below that. 2471-2480 is tough resistance. The Dow (third chart) has its uptrend line and 50-day average at 12,453-12,460. 12,550 and 12,600-12,620 are resistance. Bond yields (fourth chart) are once again testing their 200-day average ahead of Friday’s PPI report.


Internet News Logo

InternetNews is a source of industry news and intelligence for IT professionals from all branches of the technology world. InternetNews focuses on helping professionals grow their knowledge base and authority in their field with the top news and trends in Software, IT Management, Networking & Communications, and Small Business.

Property of TechnologyAdvice. © 2026 TechnologyAdvice. All Rights Reserved

Advertiser Disclosure: Some of the products that appear on this site are from companies from which TechnologyAdvice receives compensation. This compensation may impact how and where products appear on this site including, for example, the order in which they appear. TechnologyAdvice does not include all companies or all types of products available in the marketplace.