Technical Analysis: Back to the Weekly Charts | Internet News

Technical Analysis: Back to the Weekly Charts

Written By
Paul Shread
Paul Shread
Nov 18, 2005
1 minute read

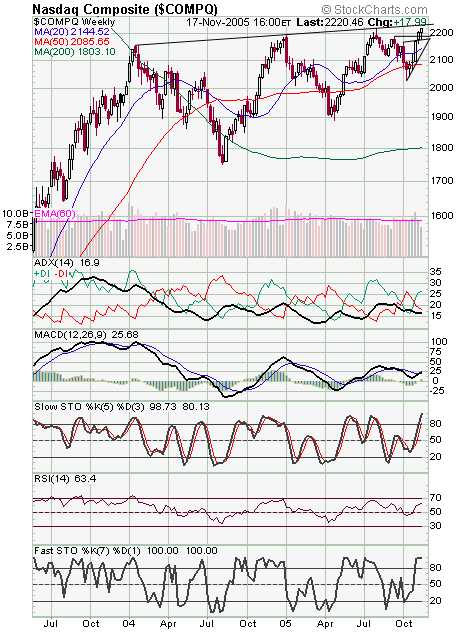
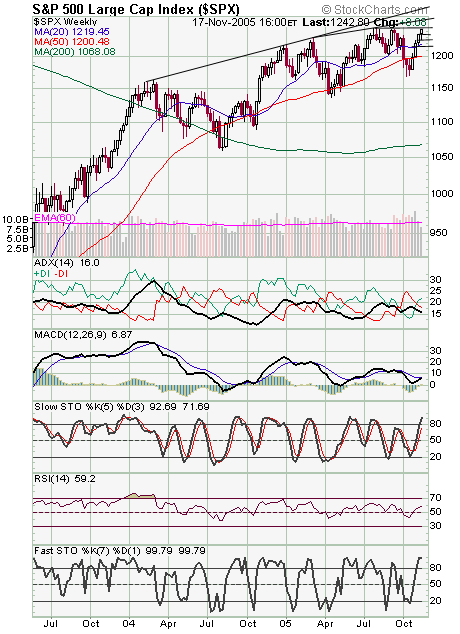
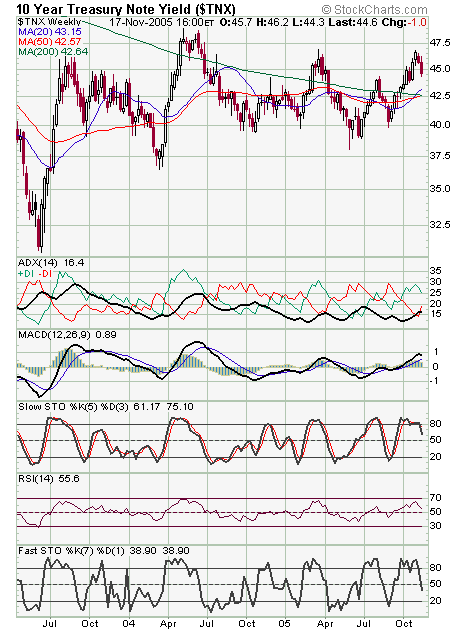
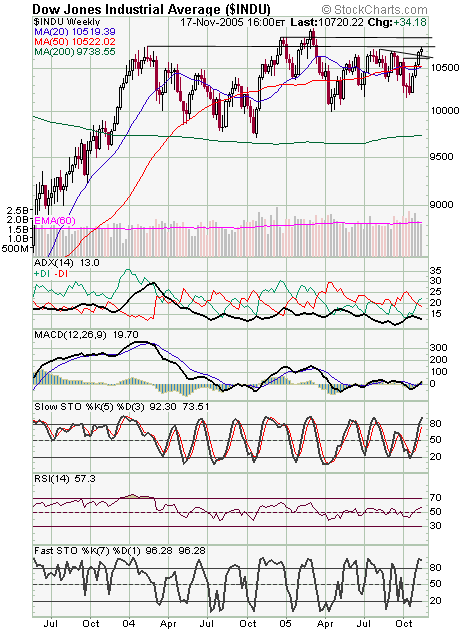
With the Nasdaq and S&P (first two charts below) once again at multi-year highs, it’s time to look at the bigger picture once again. The Nasdaq faces major resistance around 2230, and support is 2200-2207, 2182-2187 and 2175. The S&P faces major resistance at 1246, 1250-1255 and 1265, and support is 1239-1240, 1235 and 1228-1232. Not much to say about bonds (third chart) today; they continue to do the right thing here. The bigger danger is an inversion between long and short rates — a predictor of recession — if the Fed keeps hiking interest rates. The Dow (fourth chart) faces resistance between here and 10,753, with 10,850 above that, and support is 10,650-10,670, 10,600-10,620 and 10,500-10,520.


Internet News Logo

InternetNews is a source of industry news and intelligence for IT professionals from all branches of the technology world. InternetNews focuses on helping professionals grow their knowledge base and authority in their field with the top news and trends in Software, IT Management, Networking & Communications, and Small Business.

Property of TechnologyAdvice. © 2026 TechnologyAdvice. All Rights Reserved

Advertiser Disclosure: Some of the products that appear on this site are from companies from which TechnologyAdvice receives compensation. This compensation may impact how and where products appear on this site including, for example, the order in which they appear. TechnologyAdvice does not include all companies or all types of products available in the marketplace.