Technical Analysis: Blue Chips Find Support | Internet News

Technical Analysis: Blue Chips Find Support

Written By
Paul Shread
Paul Shread
May 23, 2006
1 minute read


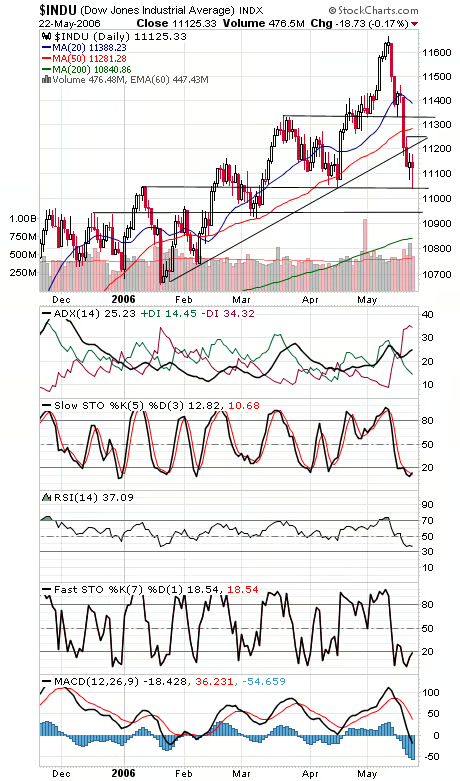
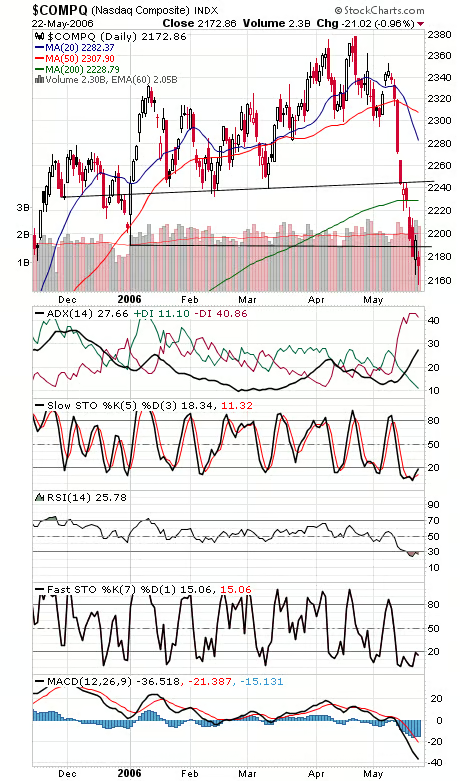
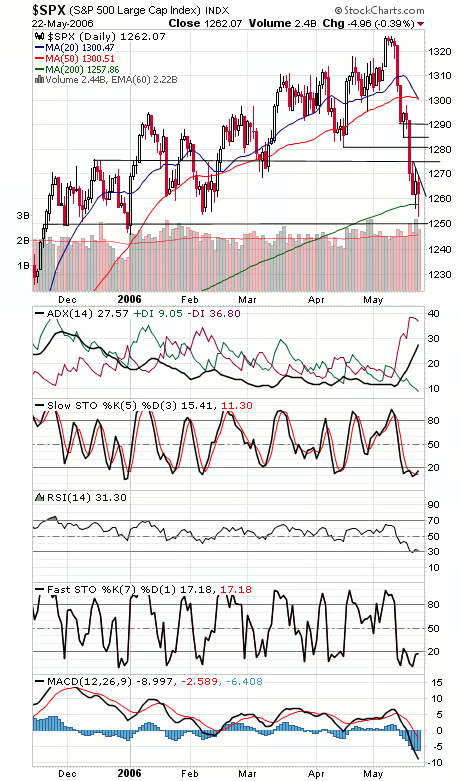
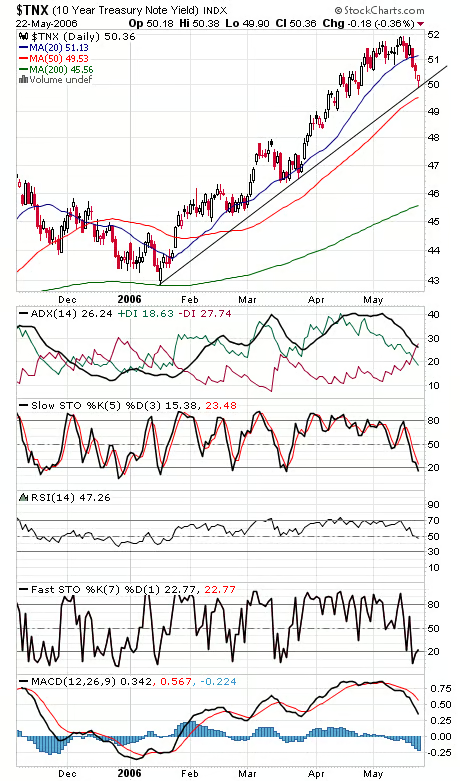
Blue chips have been able to find a little support here, but now techs need to join them. The Dow (first chart below) has a strong band of support between 10,960 and 11,040; the index bounced right at the top of that range today. Resistance is 11,180, 11,225, 11,250, 11,280 and 11,330. The Nasdaq (second chart) found support just above 2150 at 2156 today; a straight-line decline for 200 points. 2125 and 2100 are the next big support levels, and resistance is 2185-2190, 2200, 2211, 2220, 2229 and 2245-2250. The S&P (third chart) is barely hanging on to its 200-day moving average at 1258, with 1246-1251 major support below that. The index bounced at 1253 today. Resistance is 1275, 1282-1284 and 1288-1290. Another down day for long bond yields (fourth chart), barely holding onto 5%. The flight to quality is a hopeful sign for a stock market bounce.


Internet News Logo

InternetNews is a source of industry news and intelligence for IT professionals from all branches of the technology world. InternetNews focuses on helping professionals grow their knowledge base and authority in their field with the top news and trends in Software, IT Management, Networking & Communications, and Small Business.

Property of TechnologyAdvice. © 2026 TechnologyAdvice. All Rights Reserved

Advertiser Disclosure: Some of the products that appear on this site are from companies from which TechnologyAdvice receives compensation. This compensation may impact how and where products appear on this site including, for example, the order in which they appear. TechnologyAdvice does not include all companies or all types of products available in the marketplace.