Technical Analysis: Bounce Attempt | Internet News

Technical Analysis: Bounce Attempt

Written By
Paul Shread
Paul Shread
May 16, 2006
1 minute read

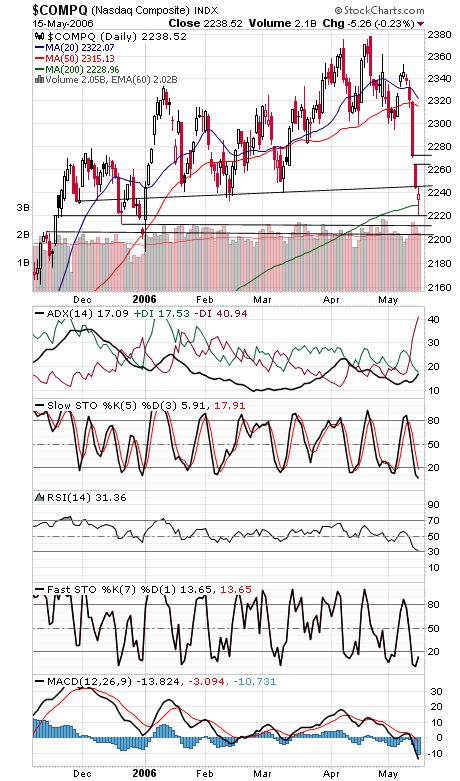
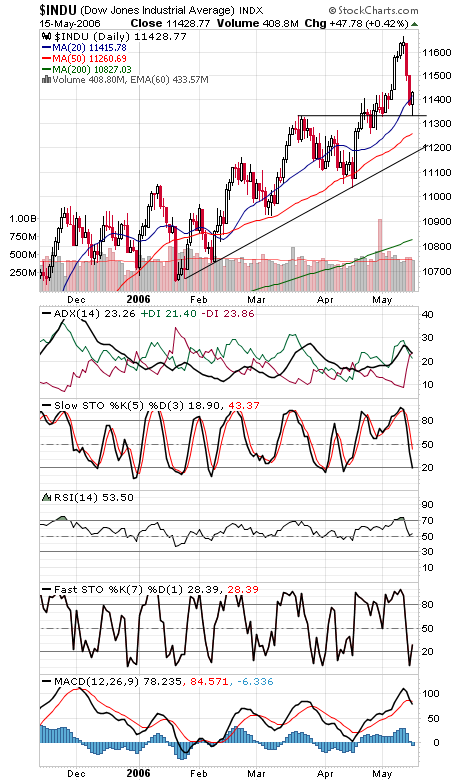
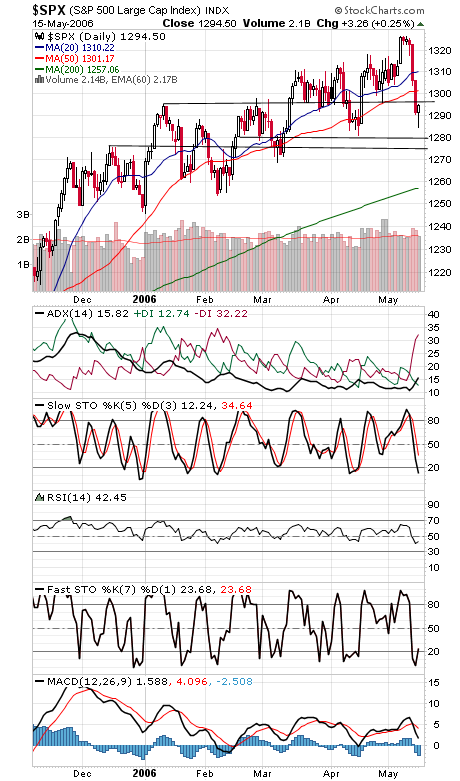
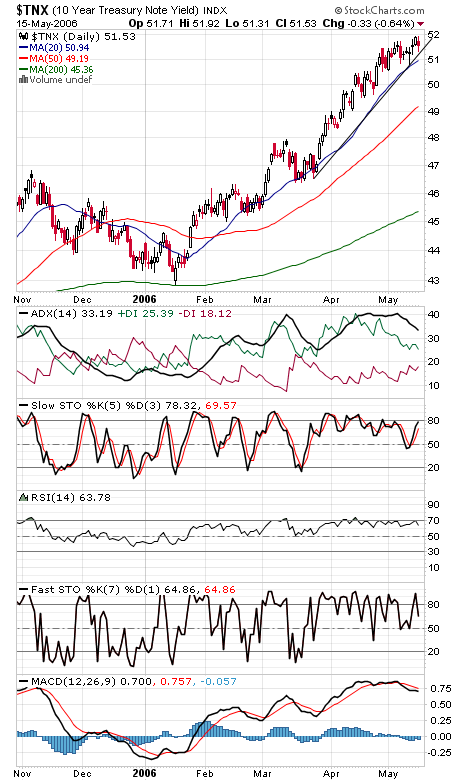
The Nasdaq (first chart below) is back below critical support at 2245. Today’s bounce ended there, but tomorrow morning’s inflation data may have a lot to say about whether the index stays below that level. The first support levels are 2229 and 2220. The Dow (second chart) has support at 11,330, 11,260 and 11,200, and resistance is 11,500, 11,600 and 11,722-11,750. The S&P (third chart) has support at 1280-1282 and 1268-1275, and resistance is 1295-1297 and 1300-1303. Long bond yields (fourth chart) have slowed their ascent; can they now turn lower? Finally, one positive today was a new 52-week low in the ISEE options sentiment index.


Internet News Logo

InternetNews is a source of industry news and intelligence for IT professionals from all branches of the technology world. InternetNews focuses on helping professionals grow their knowledge base and authority in their field with the top news and trends in Software, IT Management, Networking & Communications, and Small Business.

Property of TechnologyAdvice. © 2026 TechnologyAdvice. All Rights Reserved

Advertiser Disclosure: Some of the products that appear on this site are from companies from which TechnologyAdvice receives compensation. This compensation may impact how and where products appear on this site including, for example, the order in which they appear. TechnologyAdvice does not include all companies or all types of products available in the marketplace.