Technical Analysis: Breakdowns | Internet News

Technical Analysis: Breakdowns

Written By
Paul Shread
Paul Shread
Sep 8, 2006
1 minute read

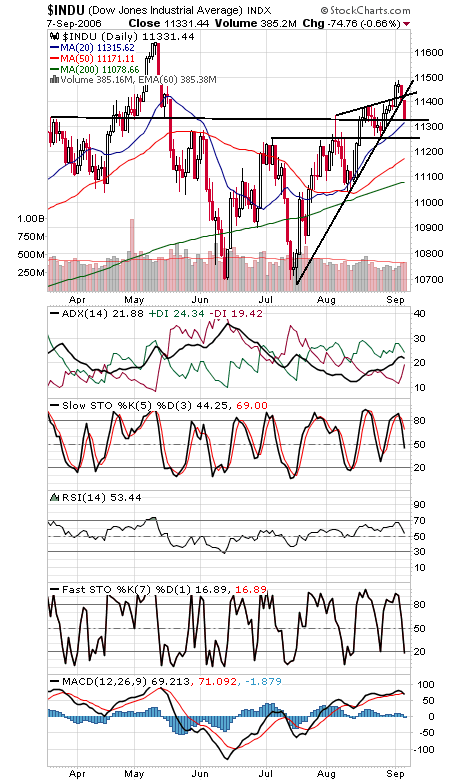
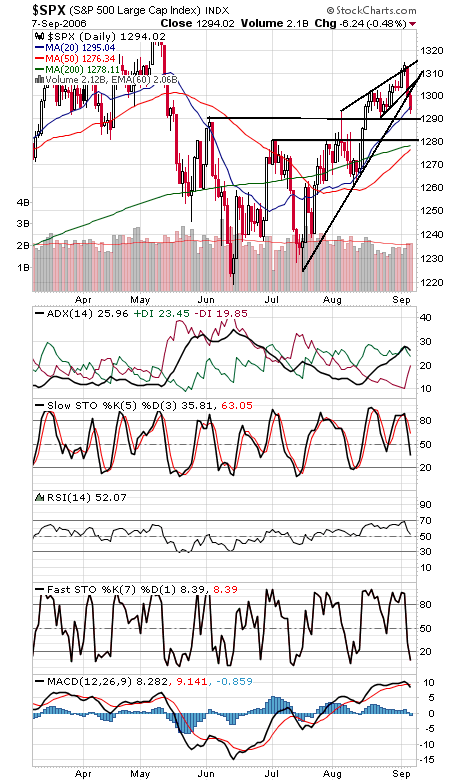
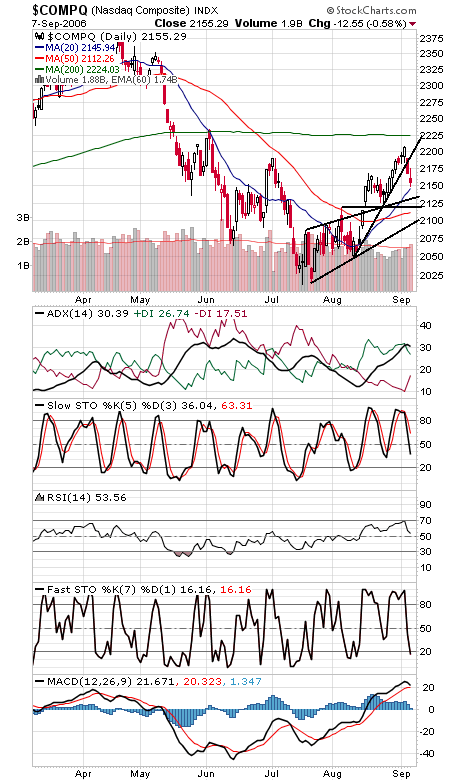
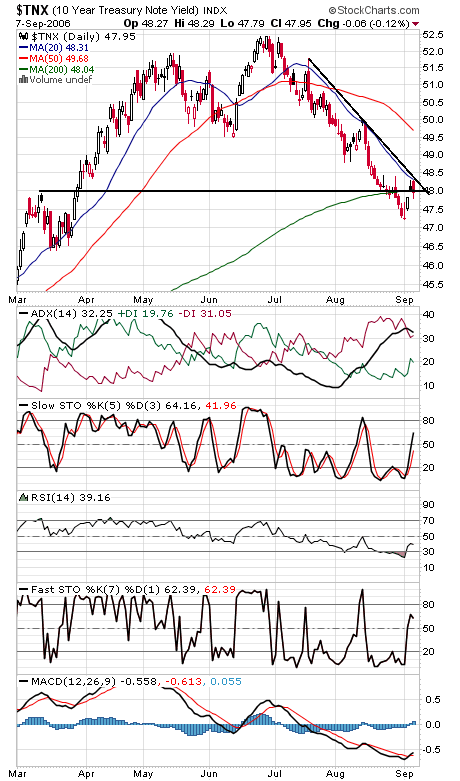
The Dow and S&P (first two charts below) broke their uptrends today, following the Nasdaq’s (third chart) breakdown yesterday. Again, the indexes could be starting a “C” wave down here to complete the correction begun in May, just in time for the four-year cycle low next month. The Dow closed right at 11,330 support, with 11,250 below that. Resistance on the blue chips is 11,430 and 11,460. The S&P faces resistance at 1305, and support is 1289-1292 and 1281. The Nasdaq needs to hold 2150 or 2132 and 2115-2125 come into play. Resistance is 2175, 2195 and 2200. Bond yields (fourth chart) flirted with a breakout but then turned back.


Internet News Logo

InternetNews is a source of industry news and intelligence for IT professionals from all branches of the technology world. InternetNews focuses on helping professionals grow their knowledge base and authority in their field with the top news and trends in Software, IT Management, Networking & Communications, and Small Business.

Property of TechnologyAdvice. © 2026 TechnologyAdvice. All Rights Reserved

Advertiser Disclosure: Some of the products that appear on this site are from companies from which TechnologyAdvice receives compensation. This compensation may impact how and where products appear on this site including, for example, the order in which they appear. TechnologyAdvice does not include all companies or all types of products available in the marketplace.