Technical Analysis: Breakout | Internet News

Technical Analysis: Breakout

Written By
Paul Shread
Paul Shread
May 19, 2007
1 minute read

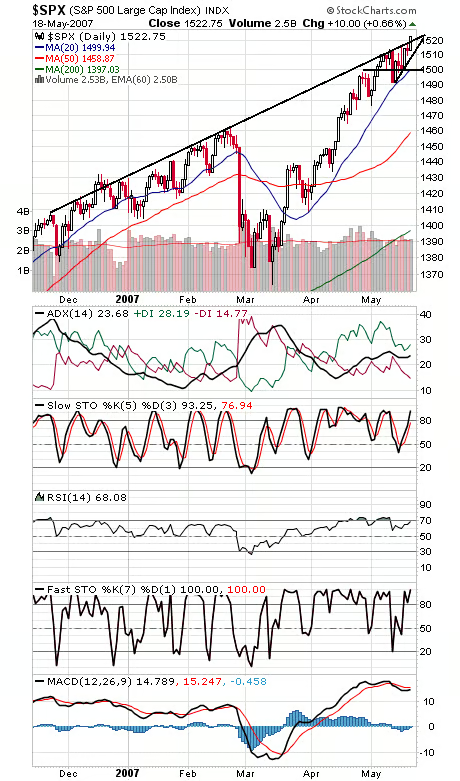
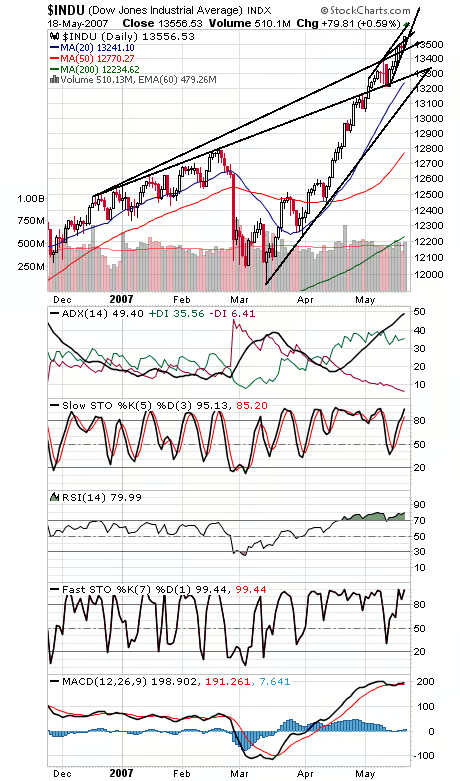
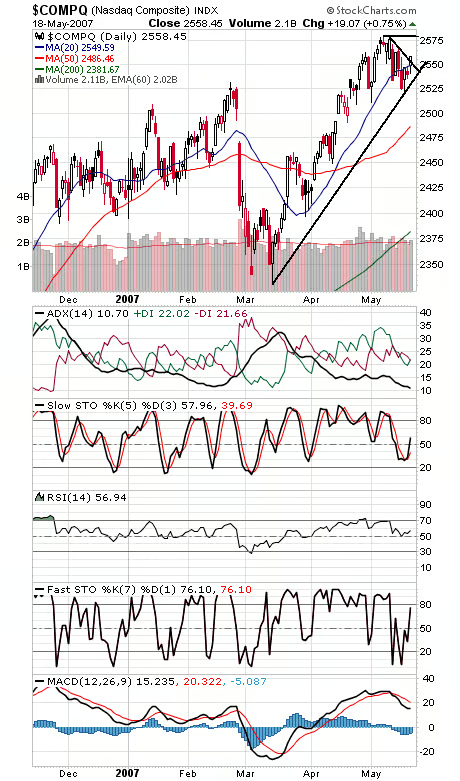
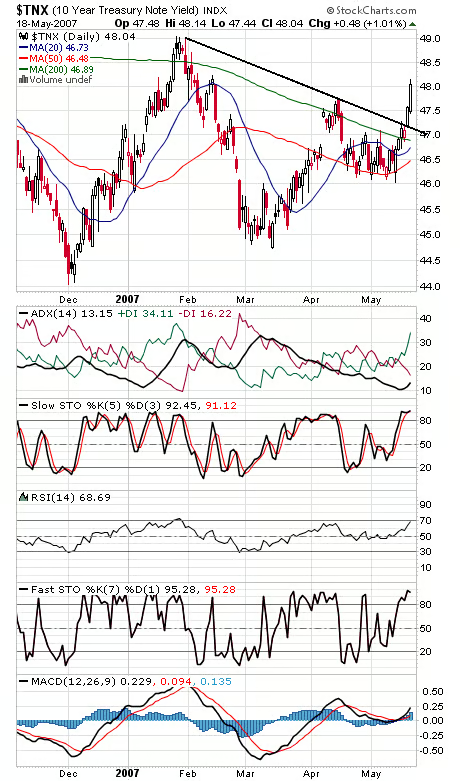
A new all-time high for the S&P (first chart below) may be a foregone conclusion at this point, just based on the index’s ability to close above a trendline that has restrained rallies since November. If the index can clear its all-time closing higher of 1527.46, its intraday peak of 1552.87 will come into play. With commercial futures traders continuing to add to long positions in the big S&P contract, the market should continue to have some support under it. 1520 is now first support, with 1510 and 1500 below that. The Dow (second chart) cleared another milestone at 13,500, which is now first support, with 13,475 just below that. The Nasdaq (third chart) is picking up nicely here, breaking out of a downtrend today. Resistance is 2580, and first support is now 2550. The 10-year yield (fourth chart) seems well on its way to 4.9%. A strengthening economy?


Internet News Logo

InternetNews is a source of industry news and intelligence for IT professionals from all branches of the technology world. InternetNews focuses on helping professionals grow their knowledge base and authority in their field with the top news and trends in Software, IT Management, Networking & Communications, and Small Business.

Property of TechnologyAdvice. © 2026 TechnologyAdvice. All Rights Reserved

Advertiser Disclosure: Some of the products that appear on this site are from companies from which TechnologyAdvice receives compensation. This compensation may impact how and where products appear on this site including, for example, the order in which they appear. TechnologyAdvice does not include all companies or all types of products available in the marketplace.