Technical Analysis: Breakouts | Internet News

Technical Analysis: Breakouts

Written By
Paul Shread
Paul Shread
Aug 25, 2007
1 minute read

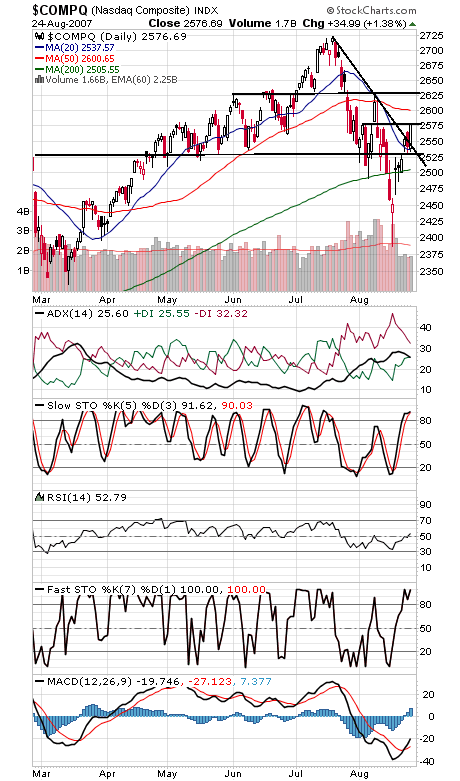
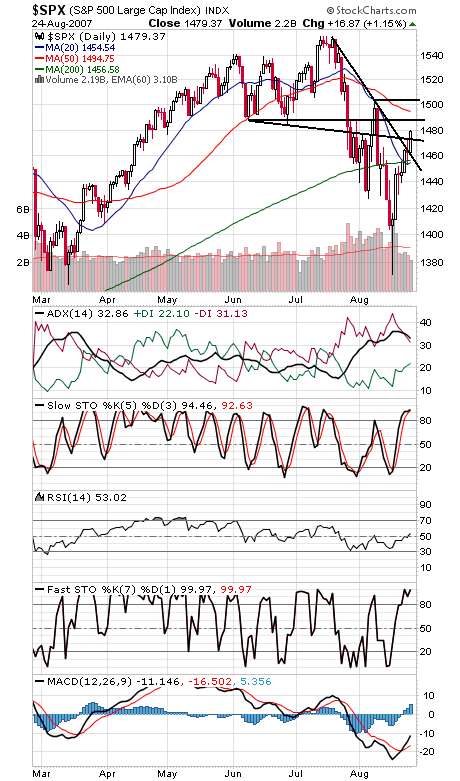
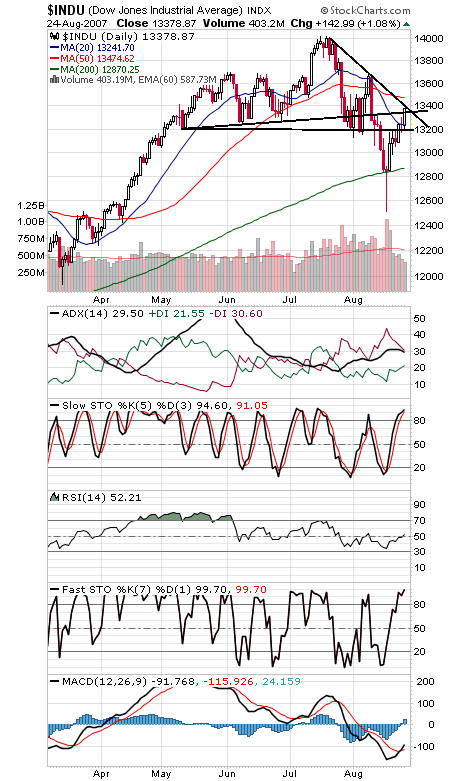
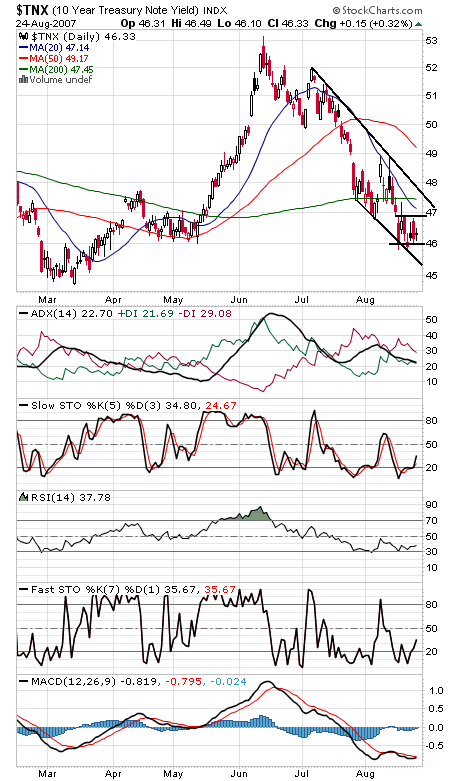
The Nasdaq and S&P (first two charts below) broke their downtrends today in strong fashion, and the Dow (third chart) is knocking on the door. Perhaps the most interesting thing about the rally is we had a very high-volume one-day reversal with no pullback to speak of at all — buyers haven’t been given much of a chance, which could continue to support the market for now. The Nasdaq closed right at 2576 resistance, with 2600 next, while support is 2550 and 2525-2530. The S&P faces next resistance at 1488, and support is 1472 and 1457-1461. Any move up by the Dow sets up a test of its 50-day average at 13,475, and support is 13,200-13,320. The ten-year yield (fourth chart) remains stuck in a holding pattern within its larger downtrend.

Paul Shread is a Chartered Market Technician (CMT) and member of the Market Technicians Association


Internet News Logo

InternetNews is a source of industry news and intelligence for IT professionals from all branches of the technology world. InternetNews focuses on helping professionals grow their knowledge base and authority in their field with the top news and trends in Software, IT Management, Networking & Communications, and Small Business.

Property of TechnologyAdvice. © 2026 TechnologyAdvice. All Rights Reserved

Advertiser Disclosure: Some of the products that appear on this site are from companies from which TechnologyAdvice receives compensation. This compensation may impact how and where products appear on this site including, for example, the order in which they appear. TechnologyAdvice does not include all companies or all types of products available in the marketplace.