A very nice rally today, but in the bigger picture, it’s a bare beginning.
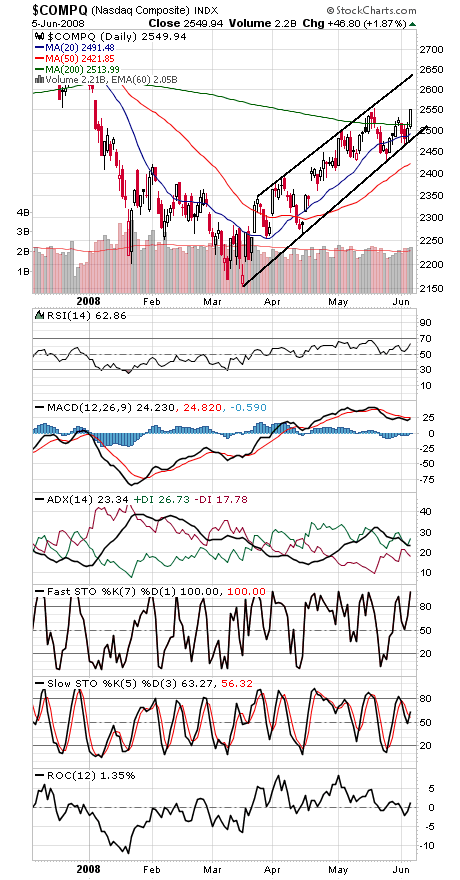
The Nasdaq (first chart below) continues to outperform strongly and is less than two points from a new recovery high, so no lack of leadership for the market. But the blue chips continue to lag badly, a worrisome sign since that’s where this bear market began and where trouble still resides.
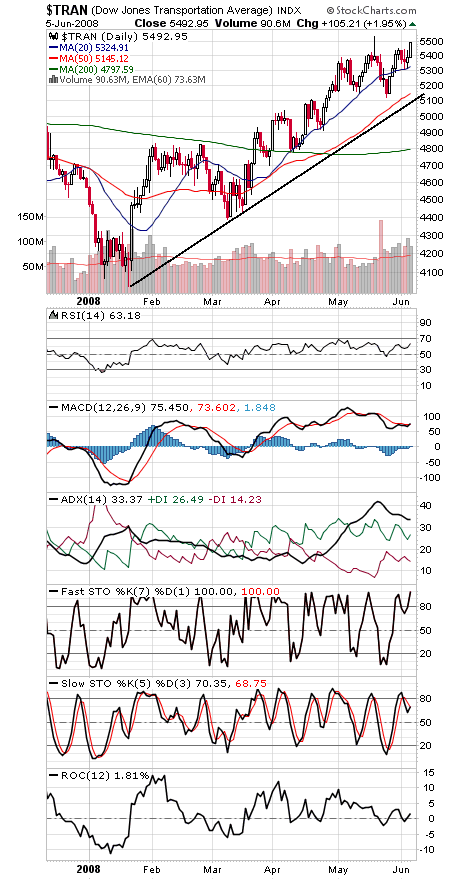
Also in the bullish camp: a new all-time high in the Dow Transports (second chart), adding to the bullish Dow Theory evidence.
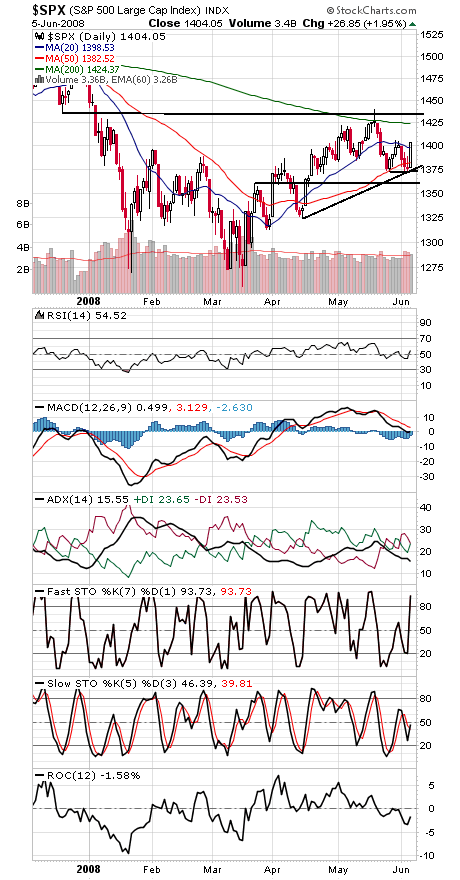
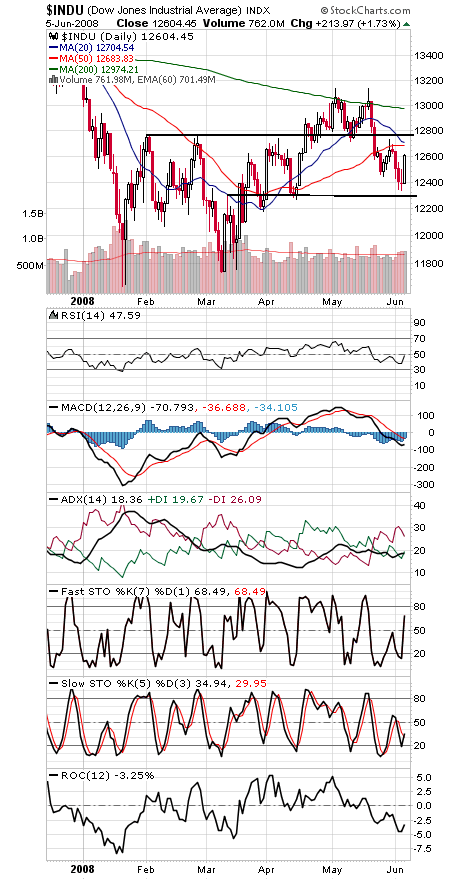
But while the Nasdaq and Transports are in a strong uptrend, the Dow and S&P (charts three and four) are still fumbling around in a trading range.
1406, 1425 and 1435-1440 are upside hurdles for the S&P (third chart), and 1383, 1375, 1370 and 1360 are support.
The Dow (fourth chart) needs to get through 12,683-12,743 to declare even a minor victory, and 12,500, 12,400 and 12,303-12,342 are support.
Paul Shread is a Chartered Market Technician (CMT) and member of the Market Technicians Association.