Technical Analysis: Bulls Get a Leg Up | Internet News

Technical Analysis: Bulls Get a Leg Up

Written By
Paul Shread
Paul Shread
Jun 16, 2007
1 minute read

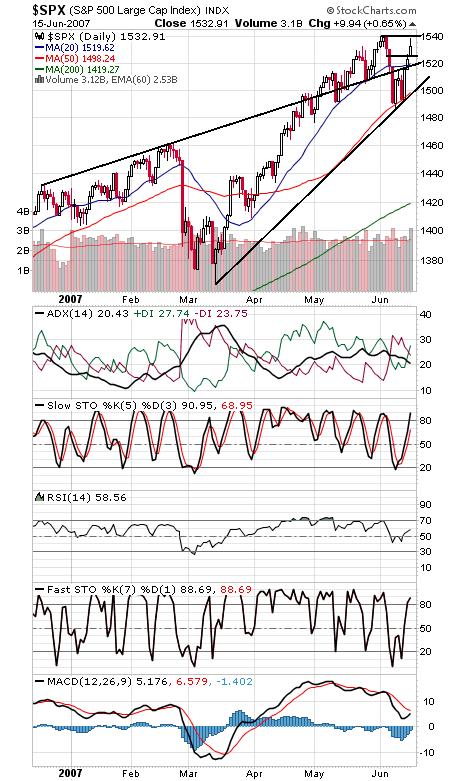
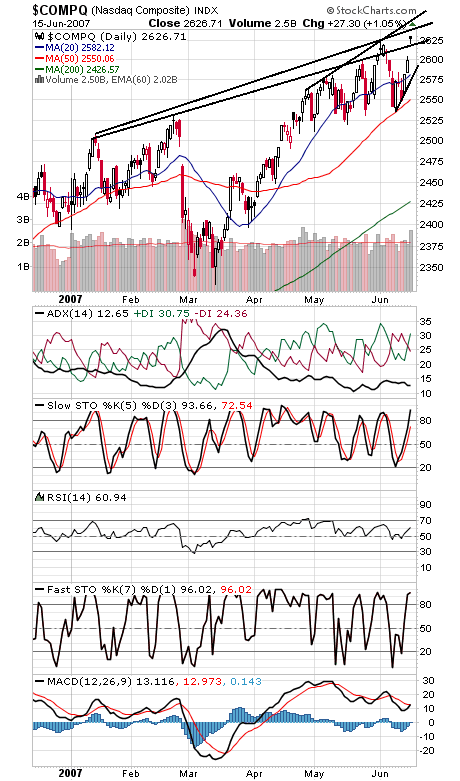
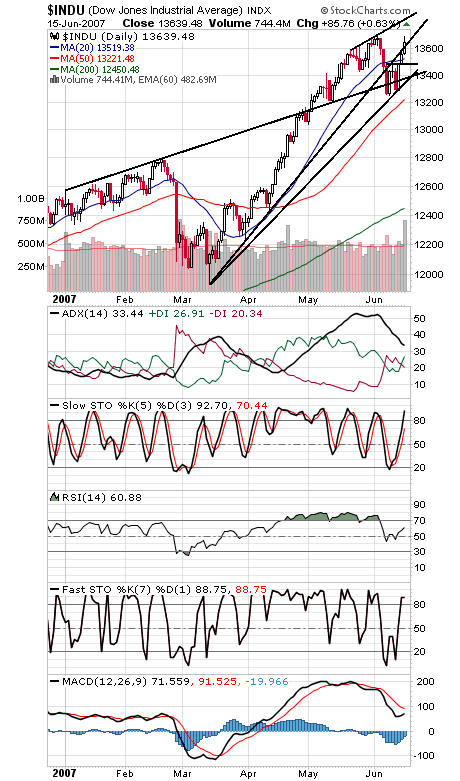
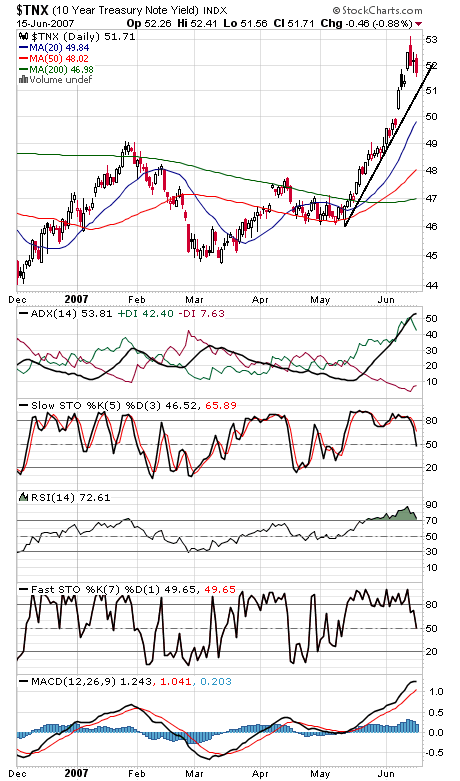
Technically, the market looks like it put in a low last week, retested it with a higher low on Tuesday, and is now headed higher again. If the S&P (first chart below) can clear 1540, it may finally be headed for its all-time intraday high of 1552.87. We’d note that commercial futures traders continue to short the big S&P futures contract, another negative data point that could eventually prove to be a problem for the market. 1527, 1523-1525 and 1520 are support. First resistance for the Nasdaq (second chart) is 2640, and 2620 and 2600-2605 are support. Above 13,692-13,700 and the Dow (third chart) could have room to run. 13,640 is first support. The 10-year yield (fourth chart) continues to back off here. 5.1% is significant first support.

Paul Shread is a Chartered Market Technician (CMT) and member of the Market Technicians Association


Internet News Logo

InternetNews is a source of industry news and intelligence for IT professionals from all branches of the technology world. InternetNews focuses on helping professionals grow their knowledge base and authority in their field with the top news and trends in Software, IT Management, Networking & Communications, and Small Business.

Property of TechnologyAdvice. © 2026 TechnologyAdvice. All Rights Reserved

Advertiser Disclosure: Some of the products that appear on this site are from companies from which TechnologyAdvice receives compensation. This compensation may impact how and where products appear on this site including, for example, the order in which they appear. TechnologyAdvice does not include all companies or all types of products available in the marketplace.