Technical Analysis: Bulls Get Tested | Internet News

Technical Analysis: Bulls Get Tested

Written By
Paul Shread
Paul Shread
Mar 7, 2006
1 minute read

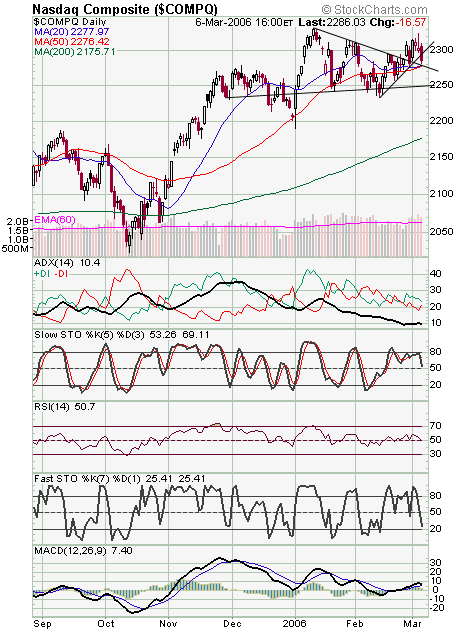
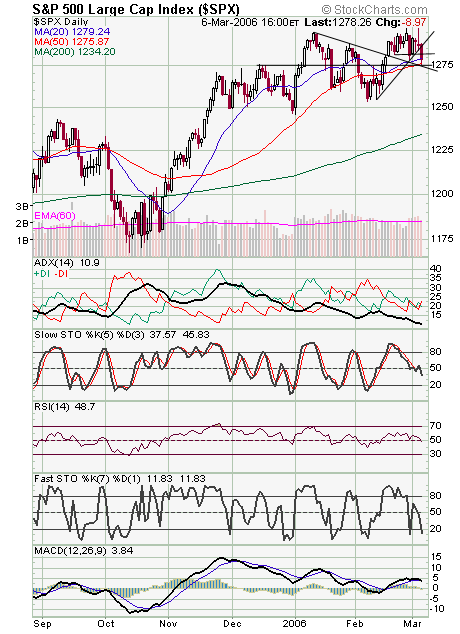
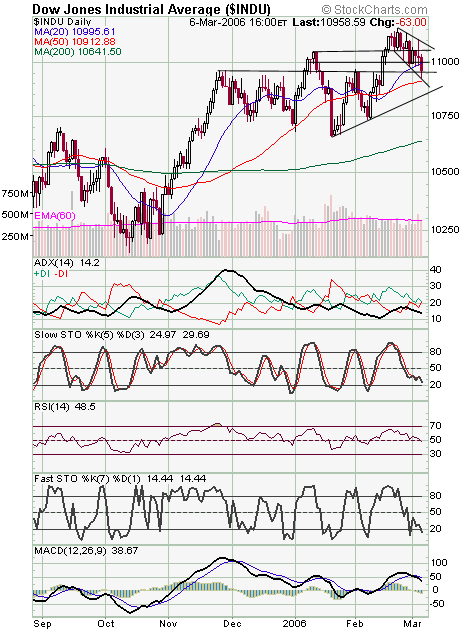
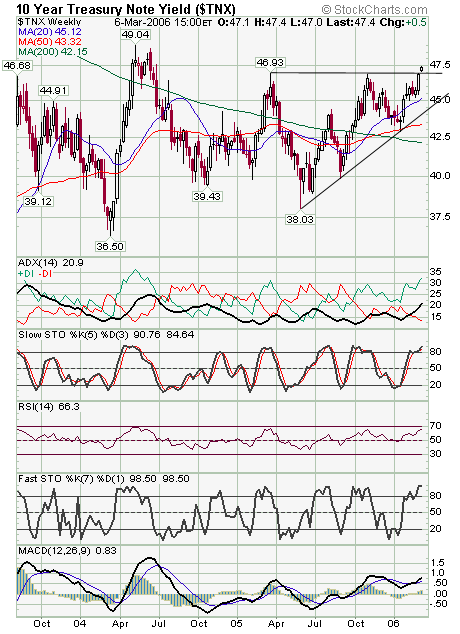
The Nasdaq (first chart below) broke its three-week uptrend today. 2276 is now important support, with 2250 the next big support level below that. 2300 is now resistance again. The S&P (second chart) is also facing a big test of support at 1273-1276. Resistance is 1282 and 1288. The Dow (third chart) has support at 10,912 and 10,850, and resistance is 11,000, 11,050 and 11,085. The reason for today’s sell-off? A 20-month high in long bond yields (fourth chart). Based on that breakout, long rates could see 5.5%.


Internet News Logo

InternetNews is a source of industry news and intelligence for IT professionals from all branches of the technology world. InternetNews focuses on helping professionals grow their knowledge base and authority in their field with the top news and trends in Software, IT Management, Networking & Communications, and Small Business.

Property of TechnologyAdvice. © 2026 TechnologyAdvice. All Rights Reserved

Advertiser Disclosure: Some of the products that appear on this site are from companies from which TechnologyAdvice receives compensation. This compensation may impact how and where products appear on this site including, for example, the order in which they appear. TechnologyAdvice does not include all companies or all types of products available in the marketplace.