Technical Analysis: Bulls Hang On | Internet News

Technical Analysis: Bulls Hang On

Written By
Paul Shread
Paul Shread
Sep 23, 2006
1 minute read


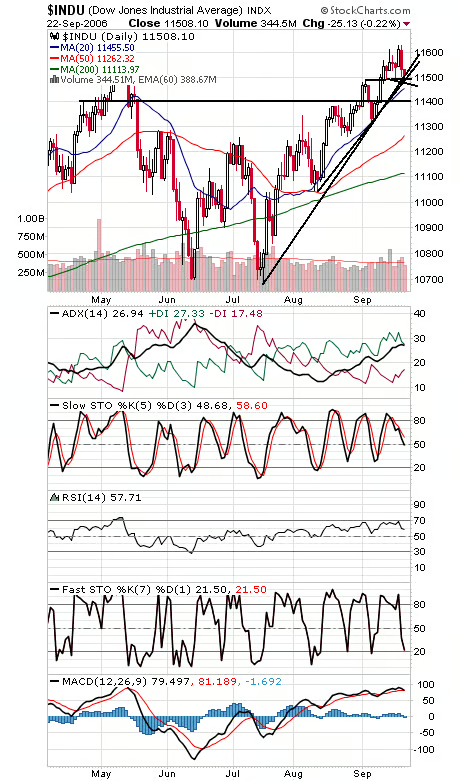
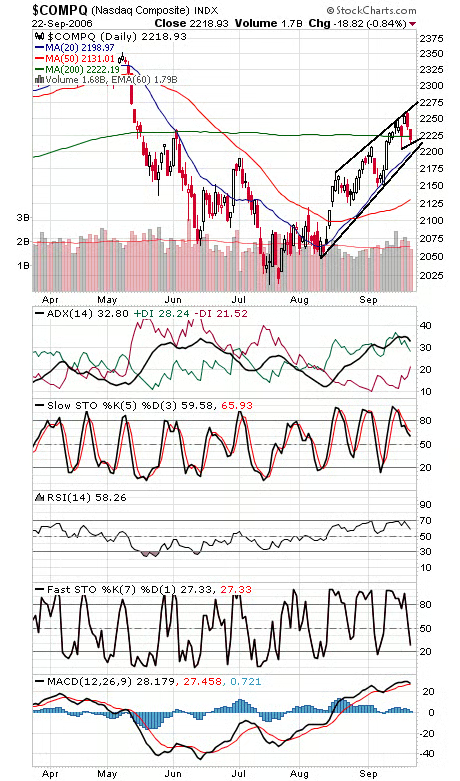
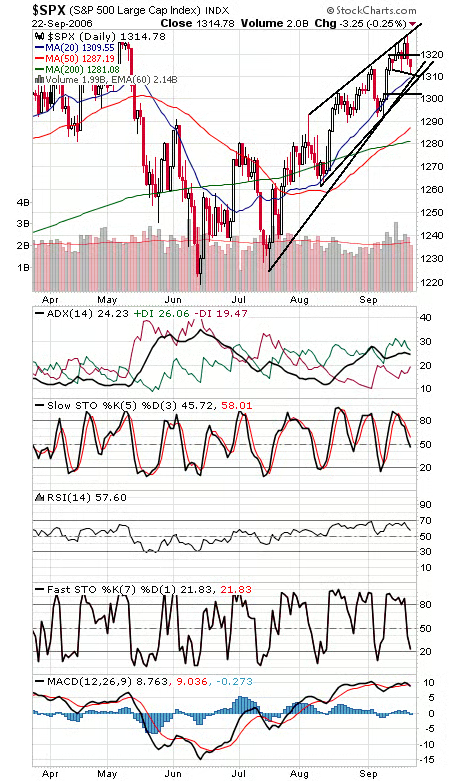
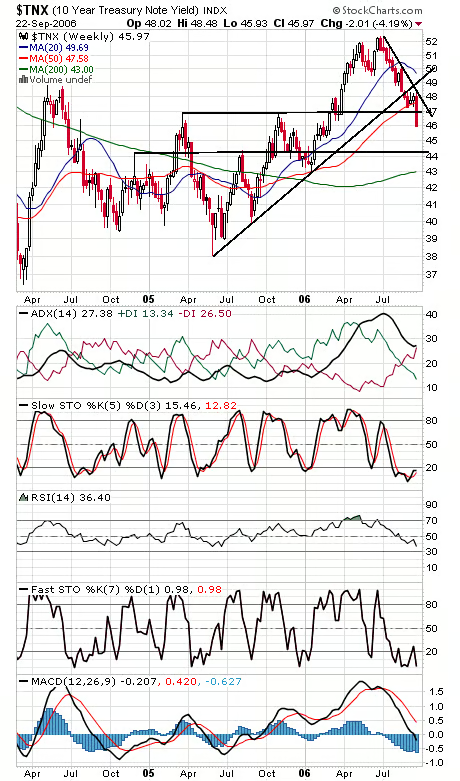
Downside remains hard to come by, as buyers stepped in again today to pull the Dow (first chart below) back from the brink. 11,470 is first support, with 11,400 below that, and upside resistance can be found at 11,525-11,533, 11,580-11,600, 11,640-11,670 and 11,722-11,750. The Nasdaq (second chart) has support at 2210 and 2200, and resistance is 2233, 2242 and 2262. The S&P (third chart) has solid support at 1310, with 1307 and 1300-1303 below that, and resistance is 1318-1320 and 1330. The two most important levels for Monday are probably 11,470 on the Dow and 1310 on the S&P, sloping support that the indexes have been trying to form the last few days. Bond yields (fourth chart) continue to price in a slowdown; it will be interesting to where that money goes when the trade unwinds.


Internet News Logo

InternetNews is a source of industry news and intelligence for IT professionals from all branches of the technology world. InternetNews focuses on helping professionals grow their knowledge base and authority in their field with the top news and trends in Software, IT Management, Networking & Communications, and Small Business.

Property of TechnologyAdvice. © 2026 TechnologyAdvice. All Rights Reserved

Advertiser Disclosure: Some of the products that appear on this site are from companies from which TechnologyAdvice receives compensation. This compensation may impact how and where products appear on this site including, for example, the order in which they appear. TechnologyAdvice does not include all companies or all types of products available in the marketplace.