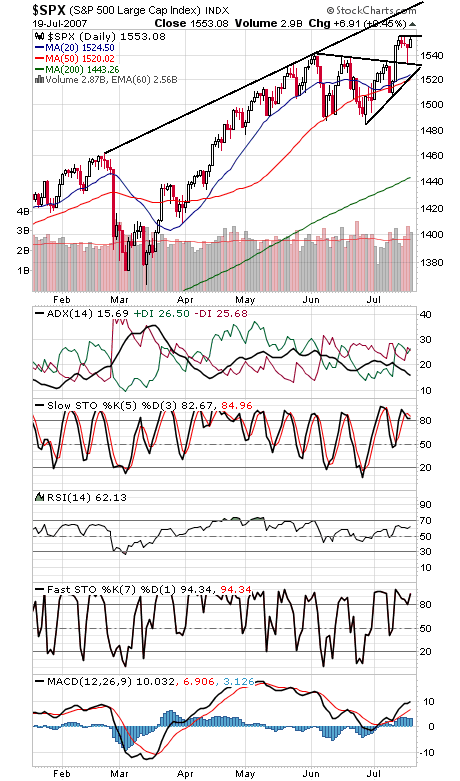
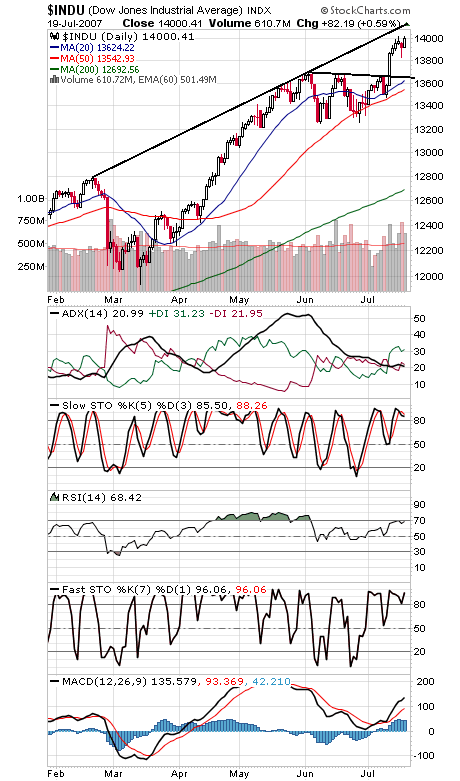
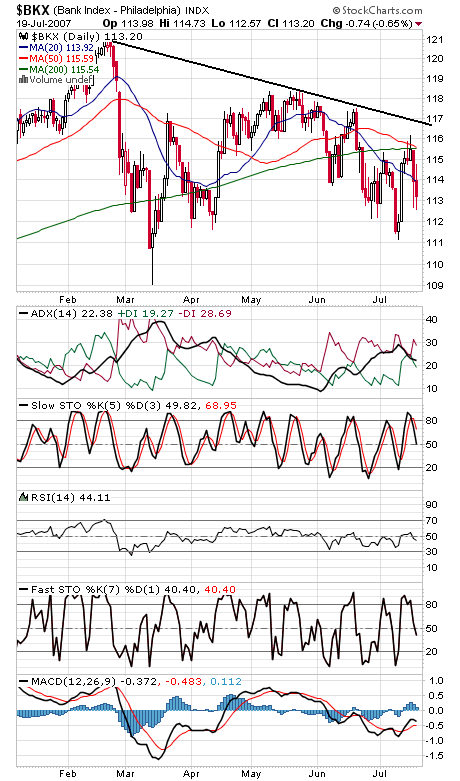
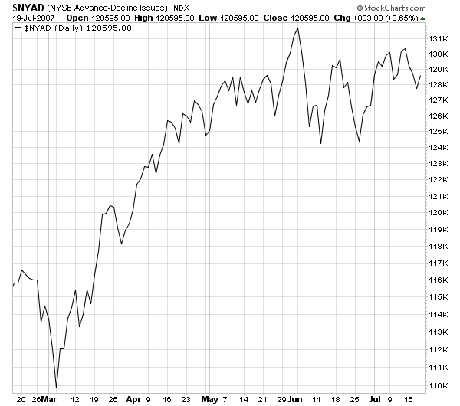
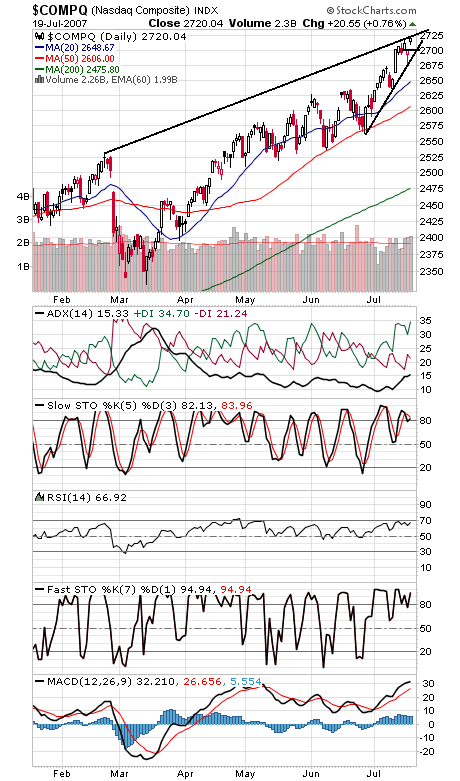
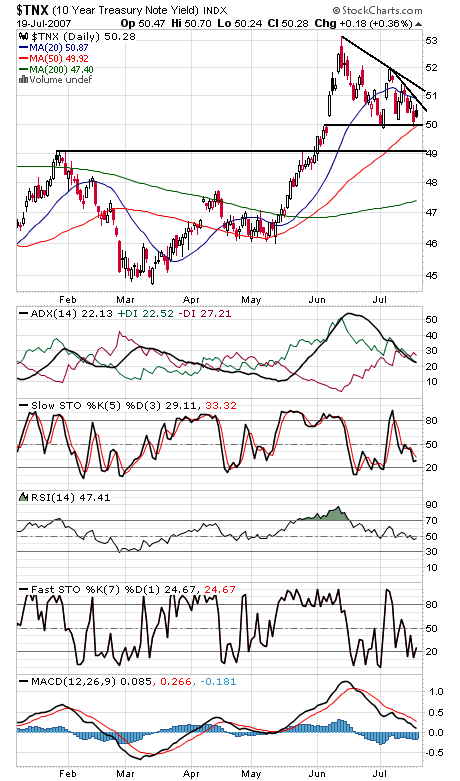
It’s taken quite some time, and even then the market barely got it done, but the Dow and S&P (first two charts below) finally eclipsed some important levels here. The S&P closed above its March 2000 high of 1552.87 and the Dow took out 14,000, although both milestones were accomplished by the slimmest of margins. The S&P still needs to clear 1556, and 1532 is important support. The Dow faces resistance at 14,020 and 14,100, and support is 13,900-13,920 and 13,800-13,820. Two notes of caution here: the financials and advance-decline line (charts three and four) are lagging badly, setting up a sizable negative divergence if they can’t follow the major indexes higher soon. The Nasdaq (fifth chart) faces resistance at 2725 and 2750-2800, and 2693-2700 is a big first support, with 2674 below that. The 10-year yield (sixth chart) is still stuck between 4.9-5.0% and 5.3%.
Paul Shread is a Chartered Market Technician (CMT) and member of the Market Technicians Association