Technical Analysis: Can Support Hold? | Internet News

Technical Analysis: Can Support Hold?

Written By
Paul Shread
Paul Shread
Jun 4, 2008
1 minute read

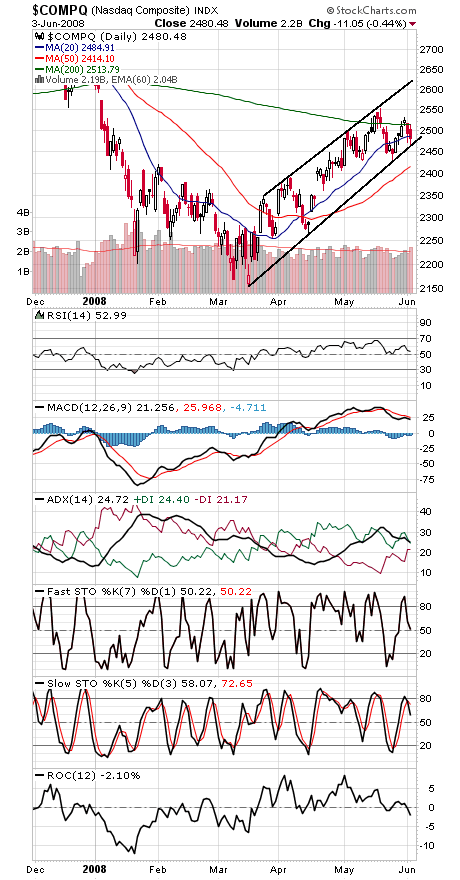
The Nasdaq (first chart below) remains the strongest index here, which is good sign for the market in general, but blue chips will have to catch a bid for the current downtrend to end.

The Nasdaq is barely hanging onto its uptrend here; that line will be at 2470 and rising tomorrow. If that goes, 2430 and 2415 come into play. To the upside, the 200-day average at 2514 would be a very good start, with 2530 and 2551 above that.

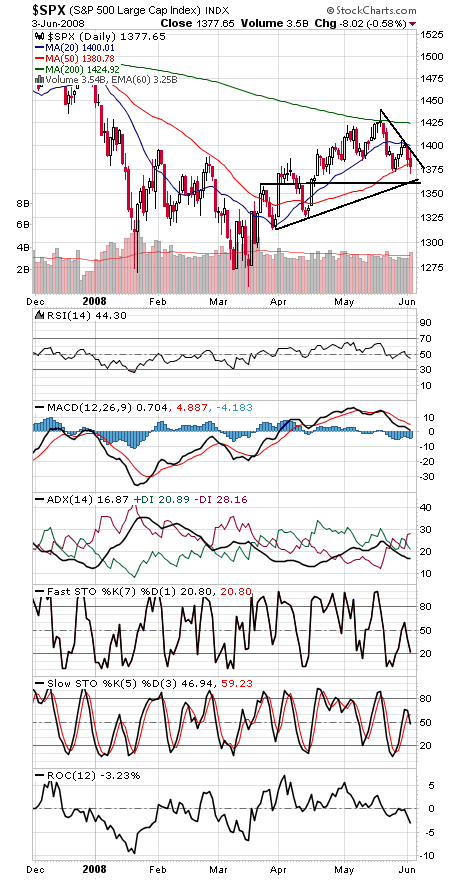
1370 and 1360 are support on the S&P (second chart), and 1381, 1385 and 1400-1406 are just the start of resistance.

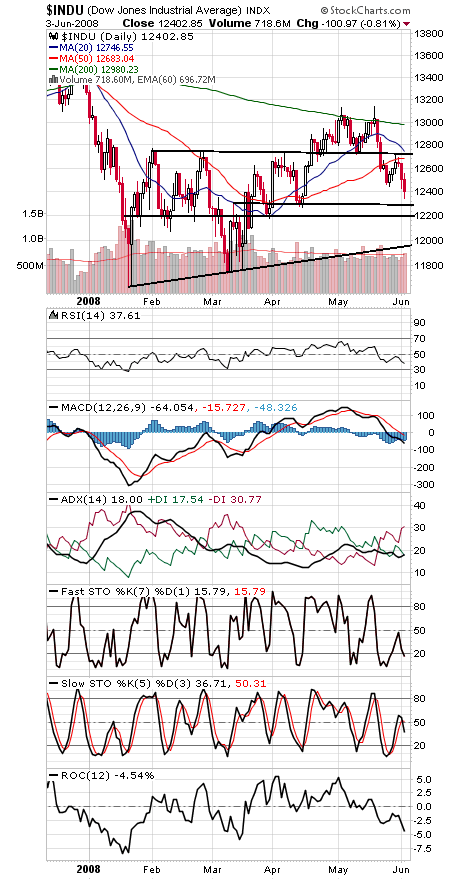
The Dow (third chart) has important support at 12,303, with 12,200 below that, and resistance is 12,683-12,743 and 12,800.

Paul Shread is a Chartered Market Technician (CMT) and member of the Market Technicians Association.

Internet News Logo

InternetNews is a source of industry news and intelligence for IT professionals from all branches of the technology world. InternetNews focuses on helping professionals grow their knowledge base and authority in their field with the top news and trends in Software, IT Management, Networking & Communications, and Small Business.

Property of TechnologyAdvice. © 2026 TechnologyAdvice. All Rights Reserved

Advertiser Disclosure: Some of the products that appear on this site are from companies from which TechnologyAdvice receives compensation. This compensation may impact how and where products appear on this site including, for example, the order in which they appear. TechnologyAdvice does not include all companies or all types of products available in the marketplace.