Technical Analysis: Choppy Rally | Internet News

Technical Analysis: Choppy Rally

Written By
Paul Shread
Paul Shread
Jul 10, 2007
1 minute read

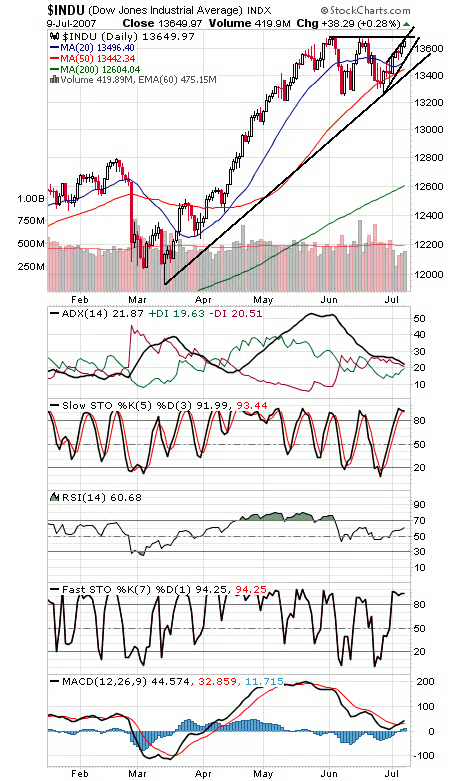
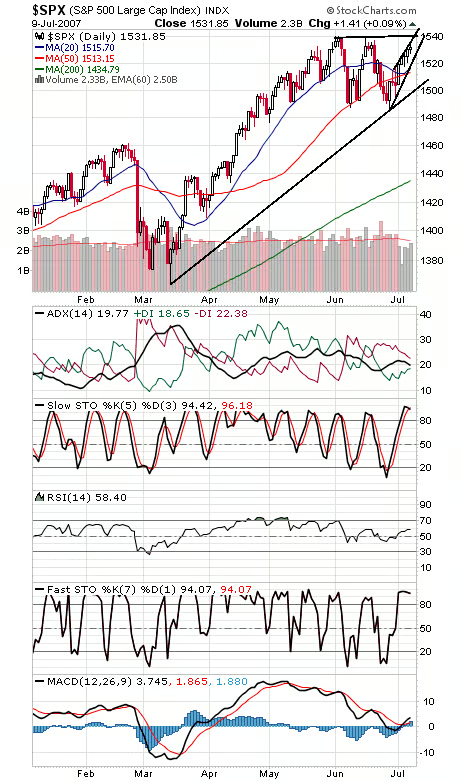
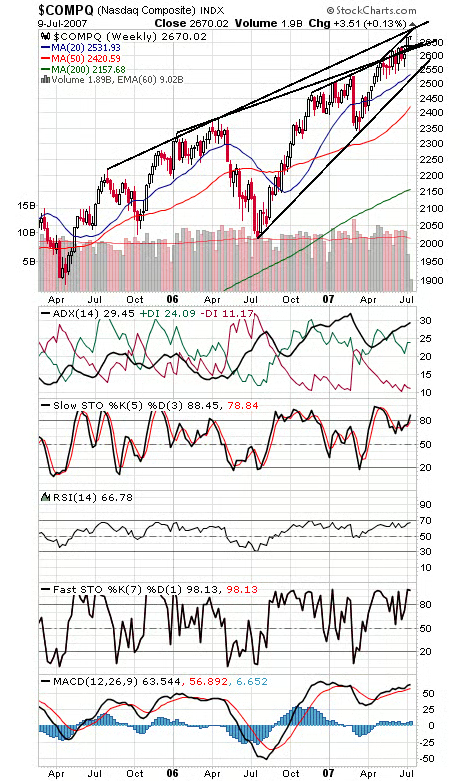
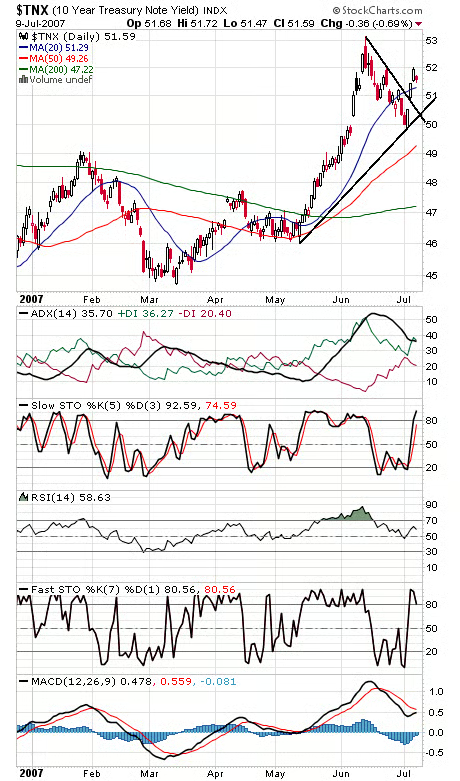
The Dow and S&P (first two charts below) continue to approach the top of a two-month trading range in very uninspiring fashion. They could set new highs here, but they’ll be vulnerable to a pullback unless they can do so convincingly. The Dow faces resistance at 13,692-13,700, and support is 13,570 and 13,500. The S&P faces resistance at 1540 and its all-time high of 1552.87, and support is 1524 and 1514. Looking at a longer-term picture, the Nasdaq (third chart) looks like 2680-2700 could be tough resistance, while 2630-2640 should now be solid support. The 10-year yield (fourth chart) continues to pause around the 5.25% neutral zone.

Paul Shread is a Chartered Market Technician (CMT) and member of the Market Technicians Association


Internet News Logo

InternetNews is a source of industry news and intelligence for IT professionals from all branches of the technology world. InternetNews focuses on helping professionals grow their knowledge base and authority in their field with the top news and trends in Software, IT Management, Networking & Communications, and Small Business.

Property of TechnologyAdvice. © 2026 TechnologyAdvice. All Rights Reserved

Advertiser Disclosure: Some of the products that appear on this site are from companies from which TechnologyAdvice receives compensation. This compensation may impact how and where products appear on this site including, for example, the order in which they appear. TechnologyAdvice does not include all companies or all types of products available in the marketplace.