Technical Analysis: Choppy Trade | Internet News

Technical Analysis: Choppy Trade

Written By
Paul Shread
Paul Shread
Jul 6, 2006
1 minute read

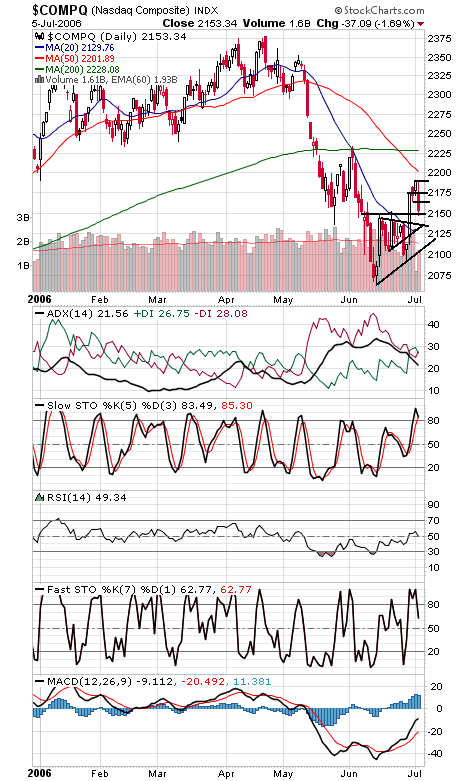
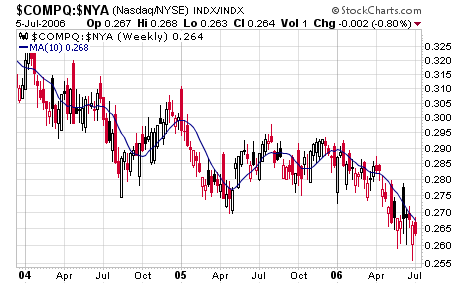
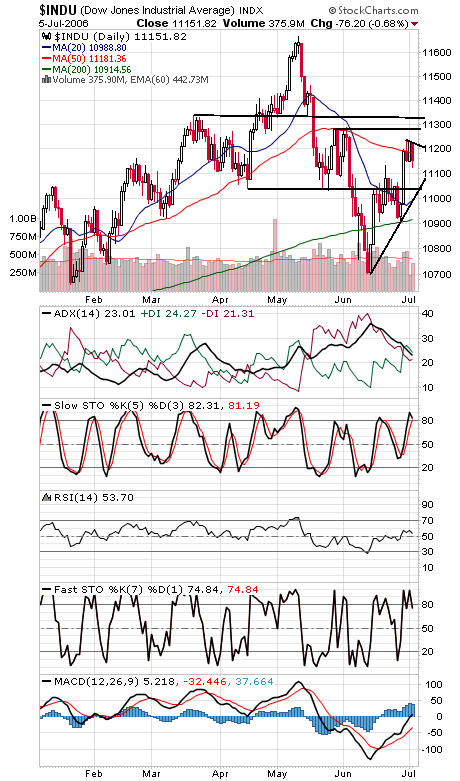
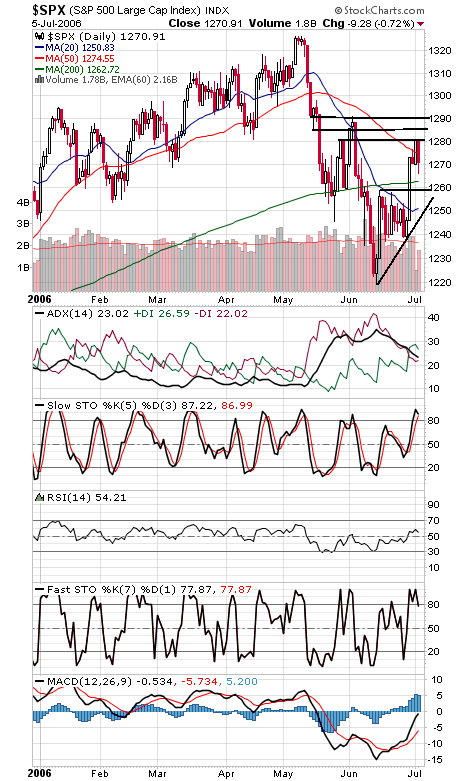
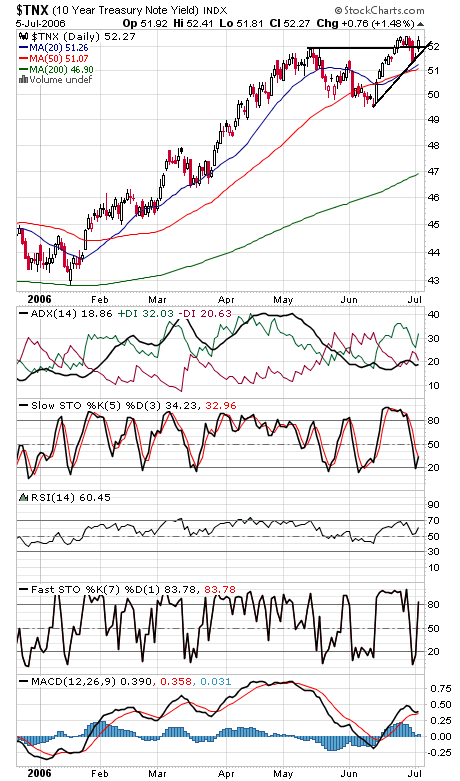
A rocky couple of days for stocks, with a complete round trip back to Friday’s levels and then some. The Nasdaq (first chart below) faces resistance at 2165, 2175 and 2190-2200, and support is 2150 and 2130-2137. We should note that the Nasdaq continues to lag the NYSE (second chart), a general market concern here. The Dow (third chart) faces resistance at 11,180, 11,220-11,240, 11,280-11,290 and 11,330, and support is 11,123-11,131, 11,100 and 11,040. The S&P (fourth chart) has support at 1263, 1258 and 1250, and resistance is 1275, 1281, 1285 and 1291. Even long bond yields (fifth chart) have made a round trip in recent days.


Internet News Logo

InternetNews is a source of industry news and intelligence for IT professionals from all branches of the technology world. InternetNews focuses on helping professionals grow their knowledge base and authority in their field with the top news and trends in Software, IT Management, Networking & Communications, and Small Business.

Property of TechnologyAdvice. © 2026 TechnologyAdvice. All Rights Reserved

Advertiser Disclosure: Some of the products that appear on this site are from companies from which TechnologyAdvice receives compensation. This compensation may impact how and where products appear on this site including, for example, the order in which they appear. TechnologyAdvice does not include all companies or all types of products available in the marketplace.