Technical Analysis: Coiling | Internet News

Technical Analysis: Coiling

Written By
Paul Shread
Paul Shread
Mar 25, 2006
1 minute read

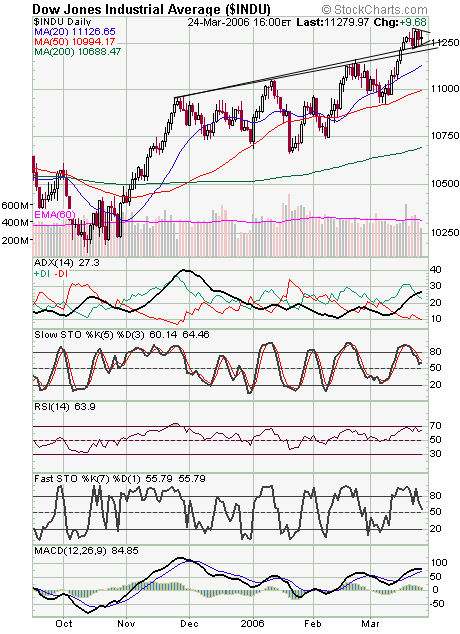
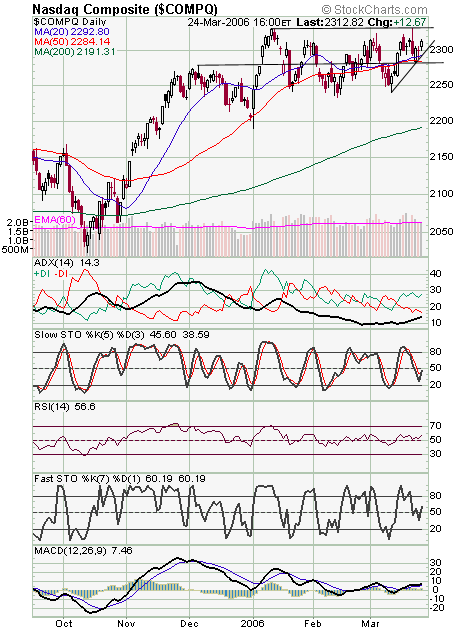
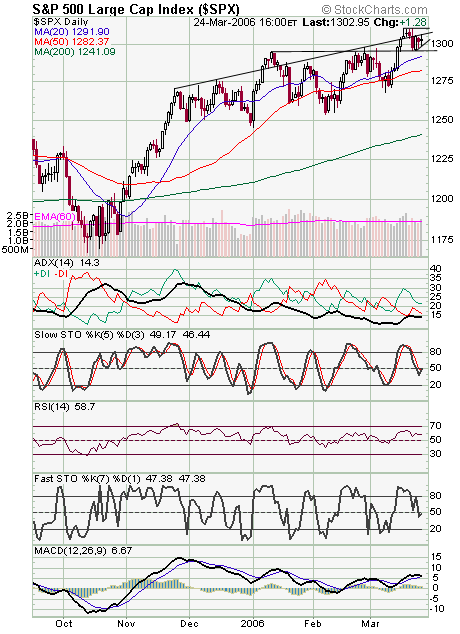
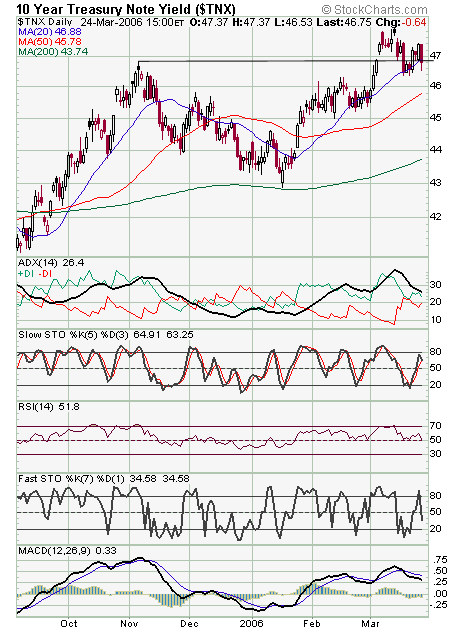
The most interesting index the last few days has been the Dow (first chart below), which is wound up in a very tight symmetrical triangle. A break above 11,317 or below 11,244 could be worth a good move for the index. The next important levels are 11,350-10,426 to the upside, and 11,210 to the downside. The Nasdaq (second chart) remains stuck in a range between 2333 to the upside and 2280-2285 to the downside. 2295-2300 is first support. The S&P (third chart) faces resistance at 1307, 1310 and 1316, and support is 1300, 1295 and 1292. A potential break from long bond yields (fourth chart) today.


Internet News Logo

InternetNews is a source of industry news and intelligence for IT professionals from all branches of the technology world. InternetNews focuses on helping professionals grow their knowledge base and authority in their field with the top news and trends in Software, IT Management, Networking & Communications, and Small Business.

Property of TechnologyAdvice. © 2026 TechnologyAdvice. All Rights Reserved

Advertiser Disclosure: Some of the products that appear on this site are from companies from which TechnologyAdvice receives compensation. This compensation may impact how and where products appear on this site including, for example, the order in which they appear. TechnologyAdvice does not include all companies or all types of products available in the marketplace.