The stock market remains within the wide trading range established two weeks ago. The big question is whether it’s trying to bottom, or whether it’s consolidating before another move down.
There is ample evidence for the bullish case, not the least of which is a deeply oversold market and extremely bearish sentiment, but price, as always, will let us know which side is right. And whichever way the current trading range breaks, the move could be big.
One positive sentiment indicator is that Investors Intelligence bears hit 54.4% today, just below the 55% level that has been a pretty good sign going back to 1970 — a level that hasn’t been seen since late 1994. And the Ted spread, a measure of banks’ willingness to lend, continues to improve — but also needs to fall another 100 basis points to get anywhere near healthy.
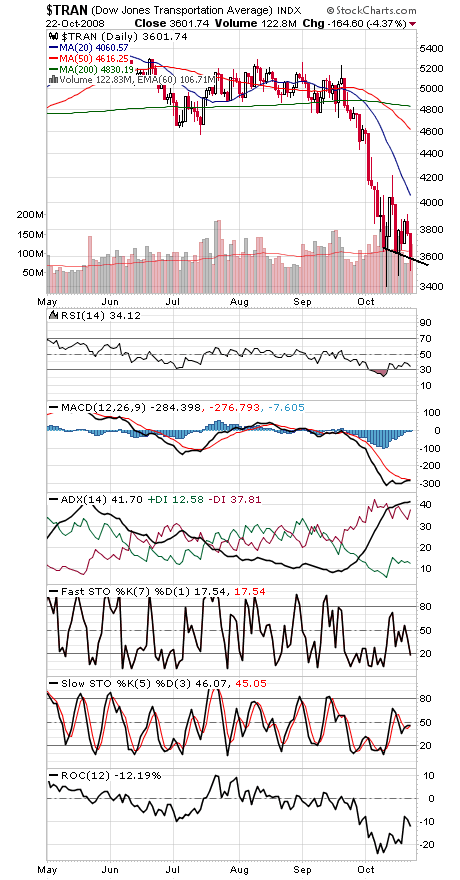
We continue to not like the succession of new closing lows in the Dow Transports (first chart below), which suggests economic weakness.
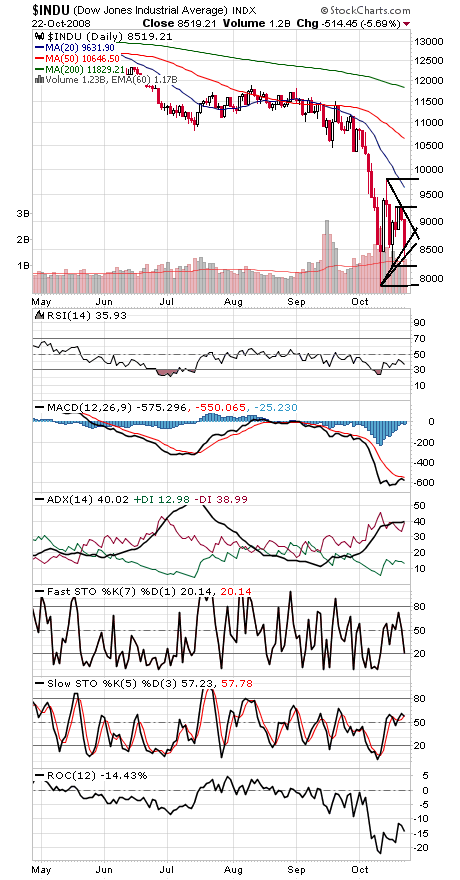
On the other hand, the Dow (second chart below) has yet to make a new closing low, a small positive. The Dow is also close to a seasonal buy signal, which has been a pretty reliable trade going back to 1950.
Levels to watch on the Dow are 9050-9085, 9266-9281, 9311-9387 and 9794 to the upside, and 8425, 8335-8387, 8197, 8000 and 7882 to the downside.
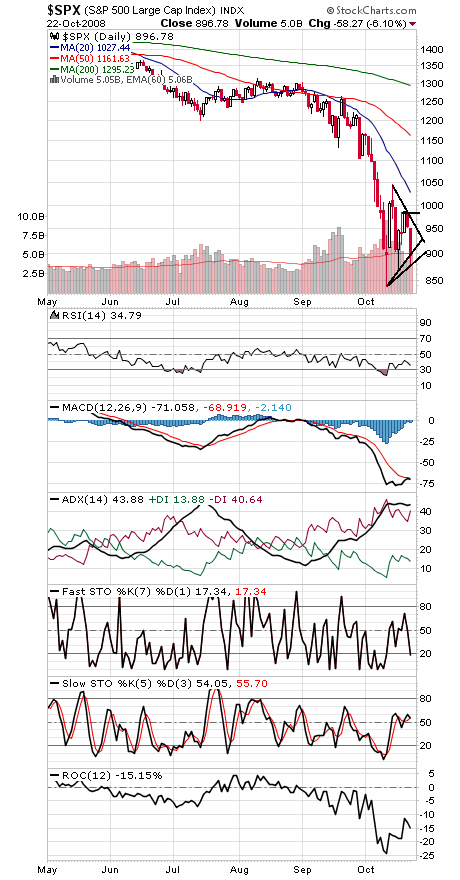
The S&P (fourth chart) faces resistance at 960, 985, 1000 and 1044-1060, and support is 885, 875, 865 and 839.
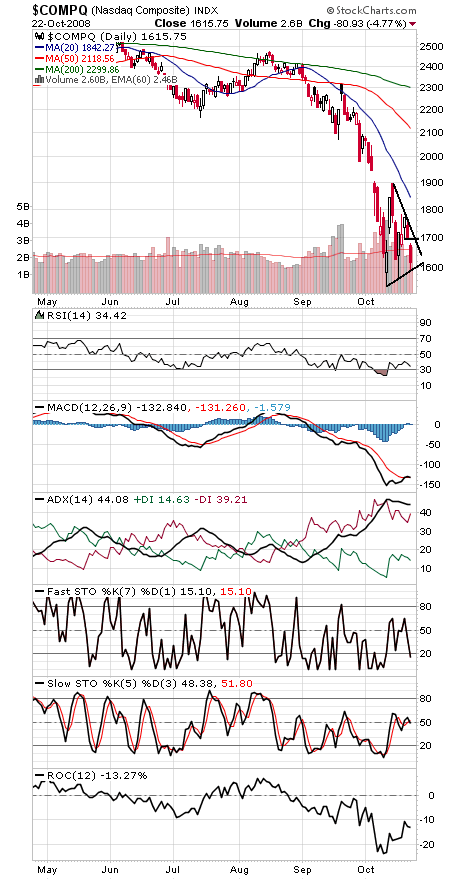
The Nasdaq (fifth chart) faces resistance at 1671-1678, 1700 and 1782, and support is 1600, 1587, 1565, 1542 and 1521.
Paul Shread is a Chartered Market Technician (CMT) and member of the Market Technicians Association.